Spread in last week's tidbits and a bit of modeling over the weekend, I see hope that this dumb reopening might just work, including the steady and slowly declining new set of cases we are seeing right now.
The Theme
Conventional wisdom holds this great good fortune is because of the lockdown. But, that wisdom warns, the minute the economy reopens, it all starts again absent the above public health or a vaccine. Conventional wisdom thus says, do not extrapolate the current trends.
The tidbits of news that give me hope, below, are that the plateau came far sooner than expected, it is lasting far longer than expected, and the shape seems quite similar across many regimes.
I hazard here a guess of why this is occurring: 1) The models do not take account that the reproduction rate R0, how many people each infected person gives it to, is immensely influenced by human behavior. And, said humans, read the news. 2) The average reproduction rate heavily influenced by super-spreading activities. The average is composed of a large majority of activities that give it to less than one other person, and a small minority of activities -- singing in choirs, beer pong at ski resorts, big loud indoor wedding parties -- that super-spread it.
Add up 1) and 2). When people hear there is a disease about, they quickly stop super-spreading activities, all on their own, because they don't want to get sick. Shutdowns only marginally affect this process. We saw, for example, massive declines in travel and restaurants long before shutdowns were announced. This action quickly and rather easily reduces the average reproduction rate to something like 5 to something below 2.
Then, as people hear news of how bad it is in their area, they adjust more. If people hear it's not so bad, they adjust less. If the virus is on the upswing, they social distance more. Do you walk or take the bus? Do you eat at a social distanced restaurant or take out? There are hundreds of little behaviors each of us take that push the reproduction rate around.
You can see a self-regulating state here, where the number of new cases sits at a steady plateau for a long time. You can easily see a self-regulation that drives the system to R0=1, or to a steady number of new cases.
That's not great news. There will still be a steady flow of new cases per week, just enough to scare people. But as people slowly start to adopt common sense and ignore silly shutdowns, and as people start to adopt common sense and avoid even permitted dangerous activities, the economy can recover a good deal. All we need is good information.
This standard model failed immediately. Growth was never near constant exponential even before shutdowns were announced. 1) We reach a plateau, and then either stay there or see slow decline. 2) The pattern is remarkably similar across countries with very different policies.
Michael Levitt at Stanford noticed
a similar mathematical pattern is observable regardless of government interventions. After around a two week exponential growth of cases (and, subsequently, deaths) some kind of break kicks in, and growth starts slowing down. The curve quickly becomes “sub-exponential”.Isaac Ben-Israel noticed the same thing,
A similar pattern – rapid increase in infections to a peak in the sixth week, and decline from the eighth week – is common everywhere, regardless of response policiesBoth have been criticized, especially the latter, for not having enough letters after their names to opine on such matters, and more cogently for not having a reason or mechanism behind their observations.
Well, with ex-post wisdom, we can add that mechanism and see where it takes us. We start with fast exponential growth. Then people notice that people around them are getting sick, and quickly take action to lower the reproduction rate below R0=1. Lockdowns also reduce the reproduction rate. Then we work through the infections already baked in to the population and approach a much, much lower peak, and decline at whatever the new R0 is.
Here the second feature is suggestive. Continuing Levitt
the total number of deaths we are seeing, in places as diverse as New York City, parts of England, parts of France and Northern Italy, all seem to level out at a very similar fraction of the total population. “Are they all practising equally good social distancing?From the Johns Hopkins data center

Here are some graphs from epiforecasts, (HT Trevor Bedford, and many links HT Marginal Revolution, essential as always). For the US as a whole

Regionally too


Plateau and decline. At far different levels, but a same pattern everywhere.
Models and data
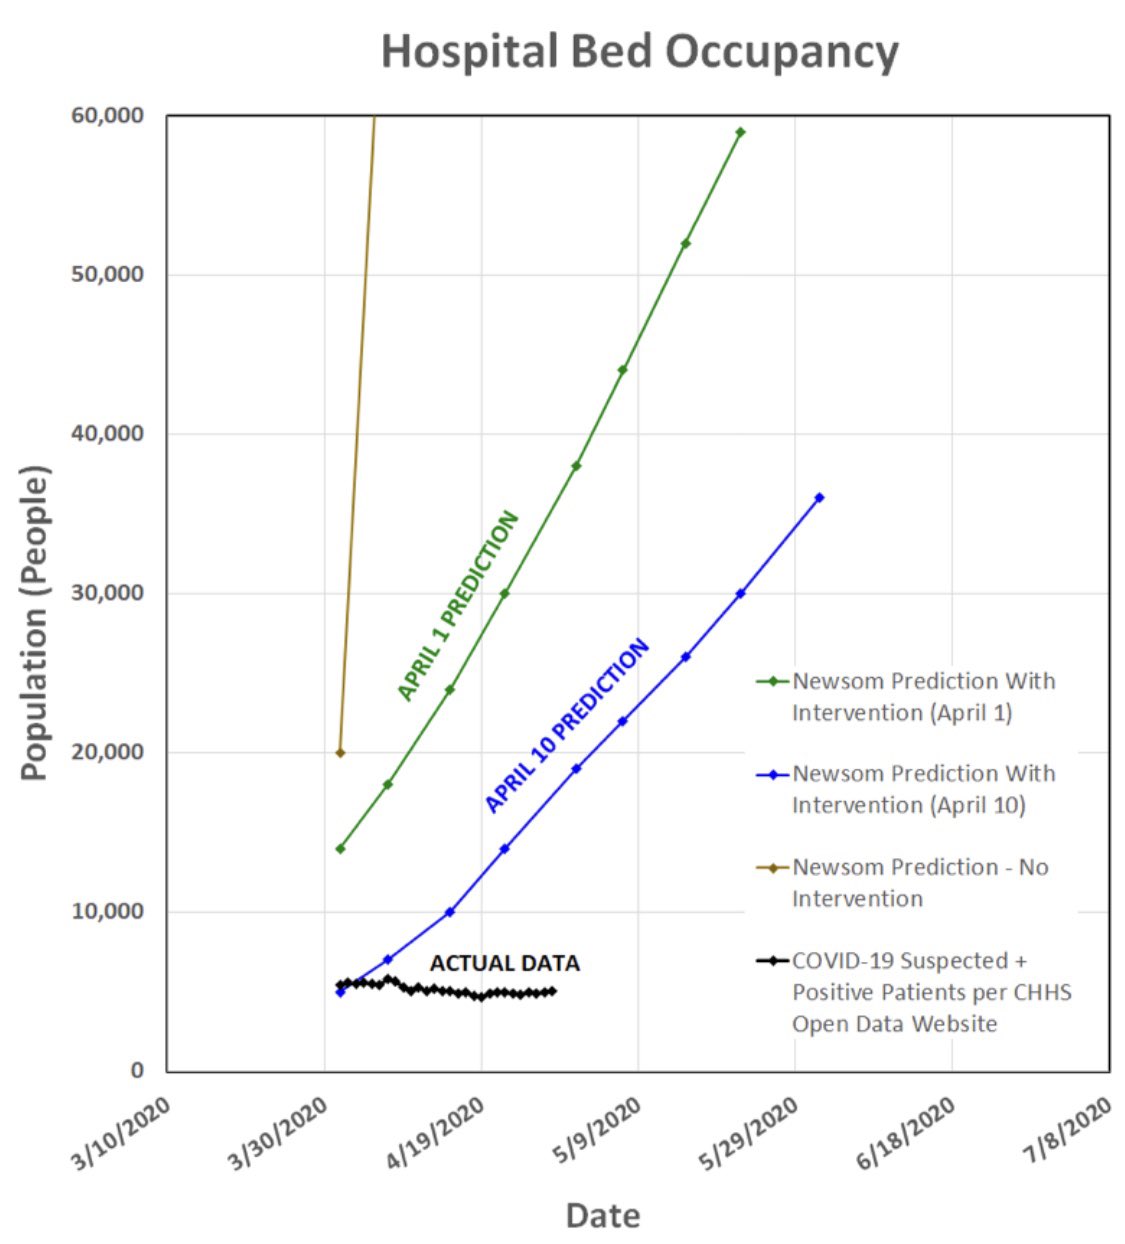
Contrast with the predictions. The standard models were really forecasting doom and gloom as of February and March. An Elon Musk tweet says it all:
Well, modelers say, governments saved us with economic shutdowns that lowered the reproduction rate, far below what the modelers thought could be achieved. See for example the beautiful Chad Jones and Jesús Fernández-Villaverde model.

Will it last?
In all these economic models, the decline in R0 reproduction rate is specified exogenously and is assumed to be due to the shutdown policies. If that's true that's a very depressing outcome because it means we will have a second wave or a depression after reopening.
If the reproduction rate responds to information, however, as I hazarded above, then we can trundle along at a reproduction rate near one for a long time.
And the remarkably similar evolution the disease across places that did very different policies argues that simple behavior rather than details of shutdown policies account for the plateau. That is the small hope on which I grasp this week.
What's needed? Obviously, a better SIR model that includes a behavioral response, sketching out my guesses here. That's in the next post.
Superspreaders
A key part of my hopeful view is that there is some easy pickings to reduce reproduction rate by avoiding obvious super-spreading activities. A reminder of the importance of variation in R0 comes from gorgeous simulations by Christopher Moore, reported by Jeana Marshall here: (underlying papers cited there)
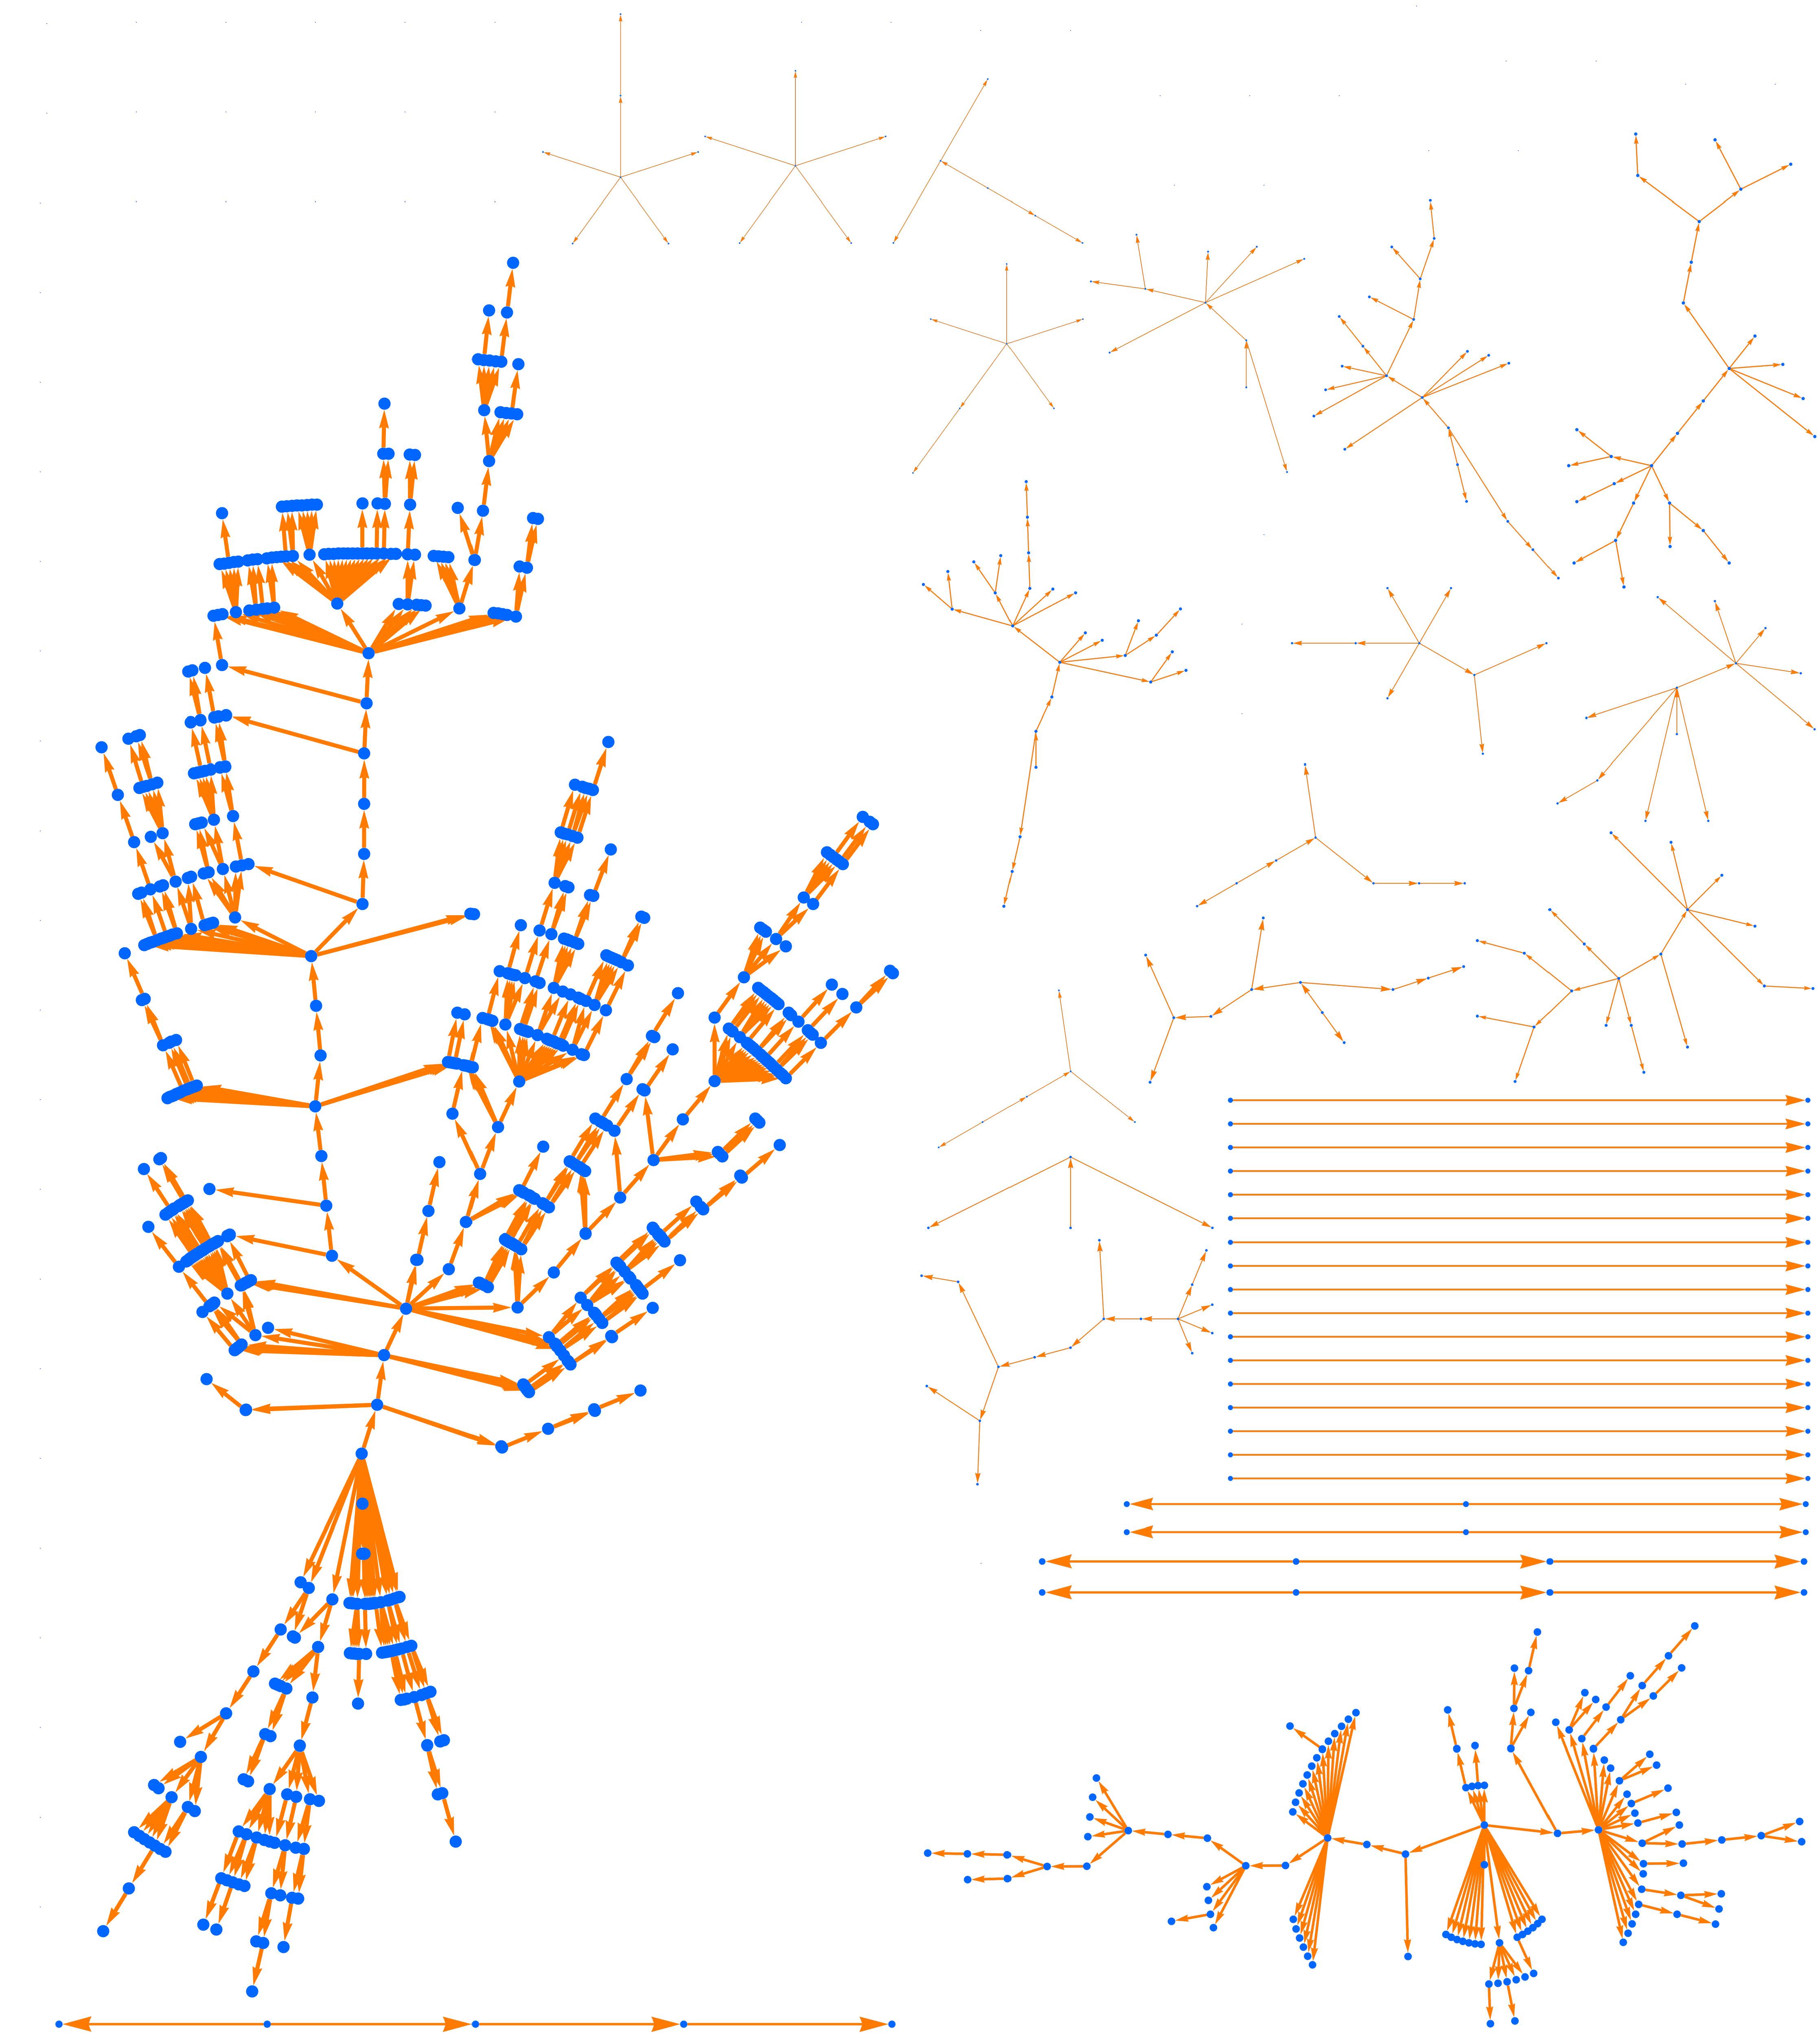
Figure 2. A hundred random outbreaks in a scenario with superspreading, where 1 percent of the cases infect 20 others. As in Figure 1, we have R0 = 0.8 and the average outbreak size is 5, but now the heavy tail of outbreaks is much heavier. In this run the largest outbreak has size 663.
This is a simulation with an average R0 = 0.8. But there are two sources of variation. First, contacts are random. If you are an R0 = 0.8 person, then you give it to one other person with 0.8 probability. That leads to a lot of variation already in how it spreads. Second, this simulation has superspreaders
... 20 percent of cases generate one new case, 10 percent generate 2, 4 percent generate 5, and 1 percent “superspread” and generate 20 (and the remaining 65 percent infect no one).Their point is how variable the outbreaks are, even with relatively large numbers -- counties, say. But one glance at any of these simulations. and you can see just how effective it would be if we could only eliminate the superspreading events.
Epilogue
The $ 6 Trillion dollar question (and it is that). Just how does this disease spread? If we only knew, for 1,000 random cases, exactly where and how they got it, and where and how they did not get it, this thing could be over quickly. We would quickly know what are the dangerous activities, and what are safe.
The other news of the week is half good and half bad. It appears there are more asymptomatic cases than we thought. That means it's less deadly than we thought. But it means it's more transmissible than we thought (higher R0), and it means that it's harder to stop than we thought. Staying home if you feel bad and have a temperature will not stop about half the infected people.
Models failed. Models are based on assumptions, often reasonable, and often guesstimated. When the assumptions are wrong, the models are wrong. Pay attention to the logic of models. Models are wrong more often than not, because they don't make the right assumptions. The SIR model wasn't wrong because it was logically faulty. It was wrong because it focused on the wrong mechanism -- development of herd immunity, not behavioral responses to lower the reproduction rate.
Just because the person giving you a computer model wears a white lab coat and calls it "science" does not mean it's truth. (Just because they wear a tweed jacket and call it "economics" doesn't mean it's the truth either.) It's a quantitative guess following from assumptions and modeling some mechanisms and not others. Economists have good experience with models, given the massive failure of the Keynesian forecasting models and the limits of growth models in the 1970s. Perhaps the failure of SIR models might teach us a little lesson about the reliability of models, and especially obscure black box models, in general.
SIR models are a failure not because of their logical deficiency, it is because of the reliance of simplistic differential equation models using time. Introducing spatial heterodoxy (that in turn mimics human behavior) into SIRs would reveal better epi models. However, most epidemiologists are not trained in spatial and spacetime hetrodox models ... Ironically, Dr. John Snow, pioneered (~1854, before germ theory) the field of epidemiology using spatial topological networks. No wonder epidemiologists are having a hard time to measure Covid because of using a handicapped tool like temporal SIRs. BTW, spatial SIRs show complete pandemicity even with R0 reaching zero!!! due to hysteresis and backward bifurcations ... Economists should look into spatial SIRs to augment their behavioral models. Efficacy lies somewhere in between temporal and spatial SIRs +behavioral econ.
ReplyDeleteOthers have estimated the social costs to becoming infected at about 3 or 4 times the private costs, and with great variation across demographic categories according to their vulnerability. Perhaps I'm missing something, but this seems to throw a wrench in the idea that we'll self-regulate to an R0 of 1; there may be a significant share of people who will not moderate their activity to a sufficient degree, regardless of an increasing level of risk. Of course this might be a feature rather than a bug - if interactions between risk categories are limited, we can safely let the virus run through the low-risk community.
ReplyDelete