First, measurement. To get past regulatory horror stories, just how do we measure the problem? They use the Mercatus Center's new RegData database, which is based on textual analysis of the Federal Register.
Second, functional form. How should we relate regulations to output? Here they use a detailed industry growth model. You may object, as to any model, but at least the mechanisms are explicit and you can choose different ones if you want. (I haven't plowed through all the equations, and am interested to hear comments from those of you who have.)
Third, estimation. They use the variation in industry outcomes related to differential regulation of those industries to estimate the effects of regulation on investment.
The bottom line is pretty startling:
Economic growth in the United States has, on average, been slowed by 0.8 percent per year since 1980 owing to the cumulative effects of regulation:A graphical summary:
If regulation had been held constant at levels observed in 1980, the US economy would have been about 25 percent larger than it actually was as of 2012.
This means that in 2012, the economy was $4 trillion smaller than it would have been in the absence of regulatory growth since 1980. This amounts to a loss of approximately $13,000 per capita,...
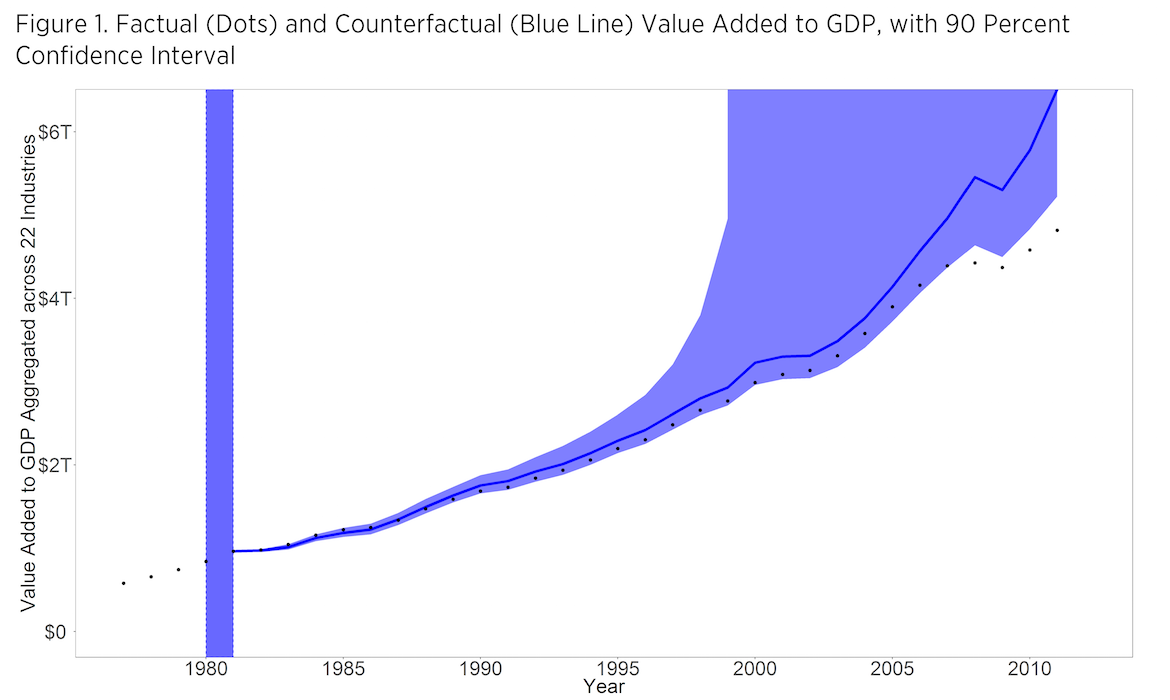
(It's interesting that the standard errors are so weighted to the up side. I checked with the authors, this is indeed how the distributions of uncertainty work out in their estimation.)
I also found this nice graph from Chad Jones,

Chad's graph differs from mine for a few reasons. First, his index of "social infrastructure" from the world bank is more comprehensive, including Accountability of politicians, Political stability, Government effectiveness, Regulatory quality, Rule of law, Control of corruption. Second, he has total factor productivity on the Y axis. The vertical axis is a log scale, so read carefully. 1.6 (Singapore) is a lot more than 1.0, though they are compressed on the graph.
Nothing has stopped sturdy sustainable growth as much as the risk weighted capital requirements for banks that have so distorted the allocation of credit to the real economy
ReplyDeletehttp://subprimeregulations.blogspot.com/2016/05/why-was-most-important-obstacle-for.html
John,
ReplyDeleteRe the confidence intervals and your recent (controversial) plot in WSJ:
Confidence and prediction intervals help a lot and would eliminate much of the confusion stemming from these sorts of regressions and their subsequent conclusions.
See for instance in the linked images below your log-linear regression on Ease of Doing Business vs. GDP per Capita, with the 95% CI and 95% PI lines included. (Note that large upside uncertainty associated with the log function is also present here -- I agree that log-linear regression is appropriate with this data snippet however such function choice would be decided a priori in such an example.)
The data I've used are from Noah's post and the following plots were generated from quickly modifying his R script. (Also worth noting is that Noah's "refutation" of your regression in testing higher order polynomials is classic case of over-fitting -- they may be reasonably excluded as worse fits by use of adj. R^2 or AIC etc.)
http://s32.postimg.org/hqodlzc7p/logscale_GDP.jpg
http://s32.postimg.org/ihh3rrel1/linscale_GDP.jpg
http://s32.postimg.org/upr5fa7bp/linscale_GDPbig.jpg
Edit previous post:
ReplyDeleteDelong's data not Noah's
If real GDP had continued to grow after 1980 at the 1946-1980 rate, it would have reached $22 trillion in 2012. That's $7 trillion above the BEA estimate for 2012. If regulations adopted after 1980 account for $4 trillion of that lost growth, what accounts for the rest? Non-regulatory inhibitors of growth (e.g., higher payroll taxes, the continuing rise in "social programs")? Underestimation of the positive effects of technology on real GDP (e.g., qualitative improvements in products and services)?
ReplyDeleteAs a NZer, I'm interested in our position well off the curve in that graph. Great social capital, poor TFP. Clearly something to think about.
ReplyDelete1. NZ may be friendly for new and small businesses, but once a certain firm size is reached (ca. 12+ employees) things become rather restrictive.
Delete2. The RMA is an unprecedented barrier to personal property rights, restrictive on the same order of magnitude as any of the bureaucratic messes and zoning laws in US or UK.
3. A small, isolated population, with a pervasive anti-intellectual culture and rest-of-the-world inferiority complex.
Meaning: as a market for international trade, NZ is not lucrative; the best and brightest go overseas; Kiwis are righteous in their dismissing of clever but foreign ideas and methods; value cheapness far more than intelligence; and do not face regular comparative reflection with other countries and cultures to see the flaws in their own ways.
None of this is captured in the usual social / business metrics.
Nice post and I liked the way you explained by using graphs.
ReplyDelete