This is my first post over at Substack. Follow me here and let me know if it isn't working.
The post is in praise of interest on reserves and abundant reserves, with (of course) some suggestions for improvements.
This is my first post over at Substack. Follow me here and let me know if it isn't working.
The post is in praise of interest on reserves and abundant reserves, with (of course) some suggestions for improvements.
This is a second post from a set of comments I gave at the NBER Asset Pricing conference in early November at Stanford. Conference agenda here. My full slides here. First post here, on new-Keynesian models
I commented on "Downward Nominal Rigidities and Bond Premia" by François Gourio and Phuong Ngo. The paper was about bond premiums. Commenting made me realize that I thought I understood the issue, and now I realize I don't at all. Understanding term premiums still seems a fruitful area of research after all these years.
I thought I understood risk premiums
The term premium question is, do you earn more money on average holding long term bonds or short-term bonds? Related, is the yield curve on average upward or downward sloping? Should an investor hold long or short term bonds?
This post is from a set of comments I gave at the NBER Asset Pricing conference in early November at Stanford. Conference agenda here. My full slides here. There was video, but sadly I took too long to write this post and the NBER took down the conference video.
I was asked to comment on "Downward Nominal Rigidities and Bond Premia" by François Gourio and Phuong Ngo. It's a very nice clean paper, so all I could think to do as discussant is praise it, then move on to bigger issues. These are really comments about whole literatures, not about one paper. One can admire the play but complain about the game.
The paper implements a version of Bob Lucas' 1973 "International evidence" observation. Prices are less sticky in high inflation countries. The Phillips curve more vertical. Output is less affected by inflation. The Calvo fairy visits every night in Argentina. To Lucas, high inflation comes with variable inflation, so people understand that price changes are mostly aggregate not relative prices, and ignore them. Gourio and Ngo use a new-Keynesian model with downwardly sticky prices and wages to express the idea. When inflation is low, we're more often in the more-sticky regime. They use this idea in a model of bond risk premia. Times of low inflation lead to more correlation of inflation and output, and so a different correlation of nominal bond returns with the discount factor, and a different term premium.
I made two points, first about bond premiums and second about new-Keynesian models. Only the latter for this post.
This paper, like hundreds before it, adds a few ingredients on top of a standard textbook new-Keynesian model. But that textbook model has deep structural problems. There are known ways to fix the problems. Yet we continually build on the standard model, rather than incorporate known ways or find new ways to fix its underlying problems.
Problem 1: The sign is "wrong" or at least unconventional.

Just in time for the holidays, the perfect stocking stuffer -- if you have really big stockings. 30% discount on Fiscal Theory of the Price Level until June 30 2024.
And Fiscal Theory makes the Economist's list of best books for 2023.


Mickey Levy's excellent WSJ oped leaves some thoughts.
Inflation has fallen, though I still suspect it may get stuck around 3-4%. But prices "are 18.9% higher than its [their] pre-pandemic level." And some important prices have risen even more. "Rental costs continue to rise in lagged response to the 46.1% surge in home prices." Those who are taking a victory lap about the end of inflation (the rate of change of prices) are befuddled by continuing consumer (and voter) anger.
Well, prices are not the same thing as inflation.
Today, I'll add an entry to my occasional reviews of interesting academic papers. The paper: "Price Level and Inflation Dynamics in Heterogeneous Agent Economies," by Greg Kaplan, Georgios Nikolakoudis and Gianluca Violante.
One of the many reasons I am excited about this paper is that it unites fiscal theory of the price level with heterogeneous agent economics. And it shows how heterogeneity matters. There has been a lot of work on "heterogeneous agent new-Keynesian" models (HANK). This paper inaugurates heterogeneous agent fiscal theory models. Let's call them HAFT.
(This post continues part 1 which just looked at the data. Part 3 on theory is here)
When the Fed raises interest rates, how does inflation respond? Are there "long and variable lags" to inflation and output?
There is a standard story: The Fed raises interest rates; inflation is sticky so real interest rates (interest rate - inflation) rise; higher real interest rates lower output and employment; the softer economy pushes inflation down. Each of these is a lagged effect. But despite 40 years of effort, theory struggles to substantiate that story (next post), it's had to see in the data (last post), and the empirical work is ephemeral -- this post.
The vector autoregression and related local projection are today the standard empirical tools to address how monetary policy affects the economy, and have been since Chris Sims' great work in the 1970s. (See Larry Christiano's review.)
I am losing faith in the method and results. We need to find new ways to learn about the effects of monetary policy. This post expands on some thoughts on this topic in "Expectations and the Neutrality of Interest Rates," several of my papers from the 1990s* and excellent recent reviews from Valerie Ramey and Emi Nakamura and Jón Steinsson, who eloquently summarize the hard identification and computation troubles of contemporary empirical work.
Maybe popular wisdom is right, and economics just has to catch up. Perhaps we will. But a popular belief that does not have solid scientific theory and empirical backing, despite a 40 year effort for models and data that will provide the desired answer, must be a bit less trustworthy than one that does have such foundations. Practical people should consider that the Fed may be less powerful than traditionally thought, and that its interest rate policy has different effects than commonly thought. Whether and under what conditions high interest rates lower inflation, whether they do so with long and variable but nonetheless predictable and exploitable lags, is much less certain than you think.
(This post is an interlude between history and VARs)
Jesper Rangvid has a great blog post today on different inflation measures.
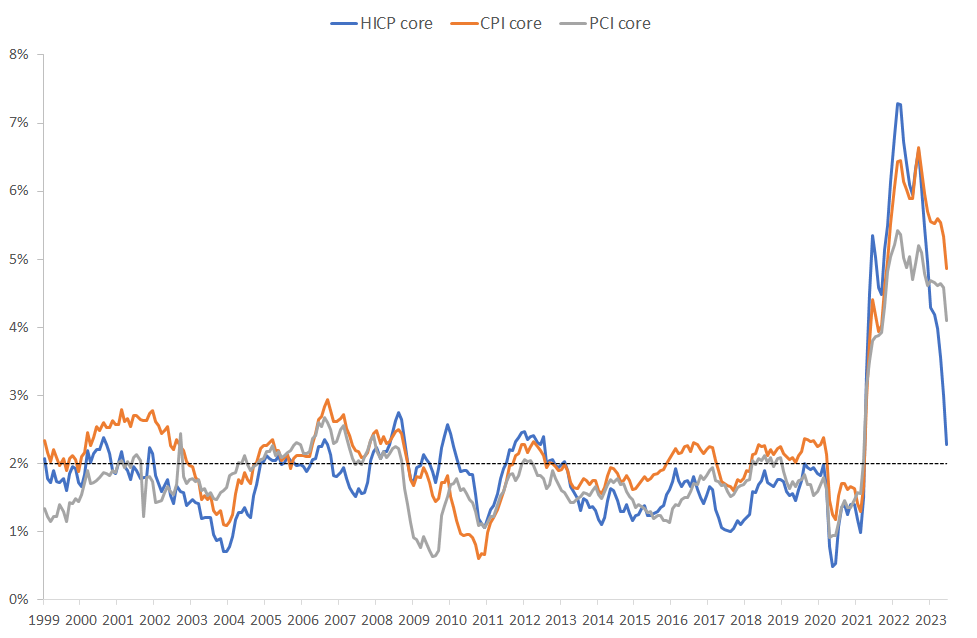
CPI and PCE core inflation (orange and gray) are how the US calculates inflation less food and energy, but including housing. We do an economically sophisticated measure that tries to measure the "cost of housing" by rents for those who rent, plus how much a homeowner pays by "renting" the house to him or herself. You can quickly come up with the plus and minus of that approach, especially for looking at month to month trends in inflation. Europe in the "HICP core" line doesn't even try and leaves owner occupied housing out altogether.
Jesper's point: if you measure inflation Europe's way, US inflation is already back to 2%. The Fed can hang out a "mission accomplished" banner. (Or, in my view, a "it went away before we really had to do anything serious about it" banner.) And, since he writes to a European audience, Europe has a long way to go.
A few deeper (and slightly grumpier) points:
I've been reading a lot of macro lately. In part, I'm just catching up from a few years of book writing. In part, I want to understand inflation dynamics, the quest set forth in "expectations and the neutrality of interest rates," and an obvious next step in the fiscal theory program. Perhaps blog readers might find interesting some summaries of recent papers, when there is a great idea that can be summarized without a huge amount of math. So, I start a series on cool papers I'm reading.
Today: "Tail risk in production networks" by Ian Dew-Becker, a beautiful paper. A "production network" approach recognizes that each firm buys from others, and models this interconnection. It's a hot topic for lots of reasons, below. I'm interested because prices cascading through production networks might induce a better model of inflation dynamics.
(This post uses Mathjax equations. If you're seeing garbage like [\alpha = \beta] then come back to the source here.)
To Ian's paper: Each firm uses other firms' outputs as inputs. Now, hit the economy with a vector of productivity shocks. Some firms get more productive, some get less productive. The more productive ones will expand and lower prices, but that changes everyone's input prices too. Where does it all settle down? This is the fun question of network economics.
Ian's central idea: The problem simplifies a lot for large shocks. Usually when problems are complicated we look at first or second order approximations, i.e. for small shocks, obtaining linear or quadratic ("simple") approximations.

 |
The central lines that don't move so much are the average rent. This is the quantity used by the Bureau of Labor Statistics to compute the consumer price index. The blue and yellow lines are the rent of new leases.
The first thing this informs is the economic theory of "sticky prices." Apartment rents are a classic "sticky price;" the rent is fixed in dollar terms for a year. So, landlords deciding how much rent to charge, and people deciding how much they're willing to pay, balance rents now vs. higher rents in the future. If everyone believes that inflation will be 10% over the next year, then it makes sense to raise the rent 5% now, and to pay the 5% higher rent, because the savings at the end of the year balance the cost in the beginning. (Obviously, the economics are much more subtle than this, but you get the idea.) And Voila', you see it.
The graph also says there is some predictability and nomentum to inflation. Inflation should not be a surprise to forecasters. If you see rents on new leases much above average rents, it's a pretty good bet that average rents will be rising in the future! This kind of phenomenon may be under exploited in formal inflation forecasting.
And, on the continuing speculation whether inflation will go away with interest rates still substantially below current inflation, the graph does seem a leading indicator that the rational expectations model is winning.
Clarification: Of course, the graph says nothing about causality; did new leases rise sharply because people expected inflation in average leases, or did new leases rise for other reasons, and we're just seeing the old theorem that marginal > average when average is rising. But it is consistent with the expectations story, and illuminates that story nicely.
We often summarize that the fiscal theory is a theory of the price level: The price level adjusts so that the real value of government debt equals the present value of surpluses. That characterization seems to leave it to a secondary role. But with any even tiny price stickiness, fiscal theory is really a fiscal theory of inflation. The following two parables should make the point, and are a good starting point for understanding what fiscal theory is really all about. This point is somewhat buried in Chapter 5.7 of Fiscal Theory of the Price Level.
Start with the response of the economy to a one-time fiscal shock, a 1% unexpected decline in the sum of current and expected future surpluses, with no change in interest rate, at time 0. The model is below, but today's point is intuition, not staring at equations. This is the continuous-time version of the model, which clarifies the intuitive points.
 |
| Response to 1% fiscal shock at time 0 with no change in interest rates |
The one-time fiscal shock produces a protracted inflation. The price level does not move at all on the date of the shock. Bondholders lose value from an extended period of negative real interest rates -- nominal interest rates below inflation.
What's going on? The government debt valuation equation with instantaneous debt and with perfect foresight is \[V_{t}=\frac{B_{t}}{P_{t}}=\int_{\tau=t}^{\infty}e^{-\int_{w=t}^{\tau}\left( i_{w}-\pi_{w}\right) dw}s_{\tau}d\tau\] where \(B\) is the nominal amount of debt, \(P\) is the price level, \(i\) is the interest rate \(\pi\) is inflation and \(s\) are real primary surpluses. We discount at the real interest rate \(i-\pi\). We can use this valuation equation to understand variables before and after a one-time probability zero "MIT shock."
With flexible prices, we have a constant real interest rate, so \(i_w-\pi_w\). Thus if there is a downward jump in \(\int_{\tau=t}^{\infty}e^{-r \tau}s_{\tau}d\tau\), as I assumed to make the plot, then there must be an upward jump in the price level \(P_t\), to devalue outstanding debt. (Similarly, a diffusion component to surpluses must be matched by a diffusion component in the price level.) The initial price level adjusts so that the real value of debt equals the present value of surpluses. This is the standard understanding of the fiscal theory of the price level. Short-term debt holders cannot be made to lose from expected future inflation.
But that's not how the simulation in the figure works, with sticky prices. Since now both \(B_t\) and \(P_t\) on the left hand side of the government debt valuation equation cannot jump, the left-hand side itself cannot jump. Instead, the government debt valuation equation determines which path of inflation \(\{\pi_w\}\) which, with the fixed nominal interest rate \(i_w\), generates just enough lower real interest rates \(\{i_w-\pi_w\}\) so that the lower discount rate just offsets the lower surplus. Short-term bondholders lose value as their debt is slowly inflated away during the period of low real interest rates, not in an instantanoues price level jump.
In this sticky-price model, the price level cannot jump or diffuse because only an infinitesimal fraction of firms can change their price at any instant in time. The price level is continuous and differentiable. The inflation rate can jump or diffuse, and it does so here; the price level starts rising. As we reduce price stickiness, the price level rise happens faster, and smoothly approaches the limit of a price-level jump for flexible prices.
In short, fiscal theory does not operate by changing the initial price level. Fiscal theory determines the path of the inflation rate. It really is a fiscal theory of inflation, of real interest rate determination.
The frictionless model remains a guide to how the sticky price model behaves in the long run. In the frictionless model, monetary policy sets expected inflation via \(i_t = r+E_t \pi_{t+1}\) or \(i_t = r+\pi_t\), while fiscal policy sets unexpected inflation \(\pi_{t+1}-E_t\pi_{t+1}\) or \(dp_t/p_t-E_t dp_t/p_t\). In the long run of my simulation, the price level does inexorably rise to devalue debt, and the interest rate determines the long-run expected inflation. But this long-run characterization does not provide useful intuition for the higher frequency path, which is what we typically want to interpret and analyze.
It is a better characterization of these dynamics that monetary policy---the nominal interest rate---determines a set of equilibrium inflation paths, and fiscal policy determines which one of these paths is the overall equilibrium, inflating away just enough initial debt to match the decline in surpluses.
 |
| Response to 1% deficit shock at time 0 with no change in interest rate |
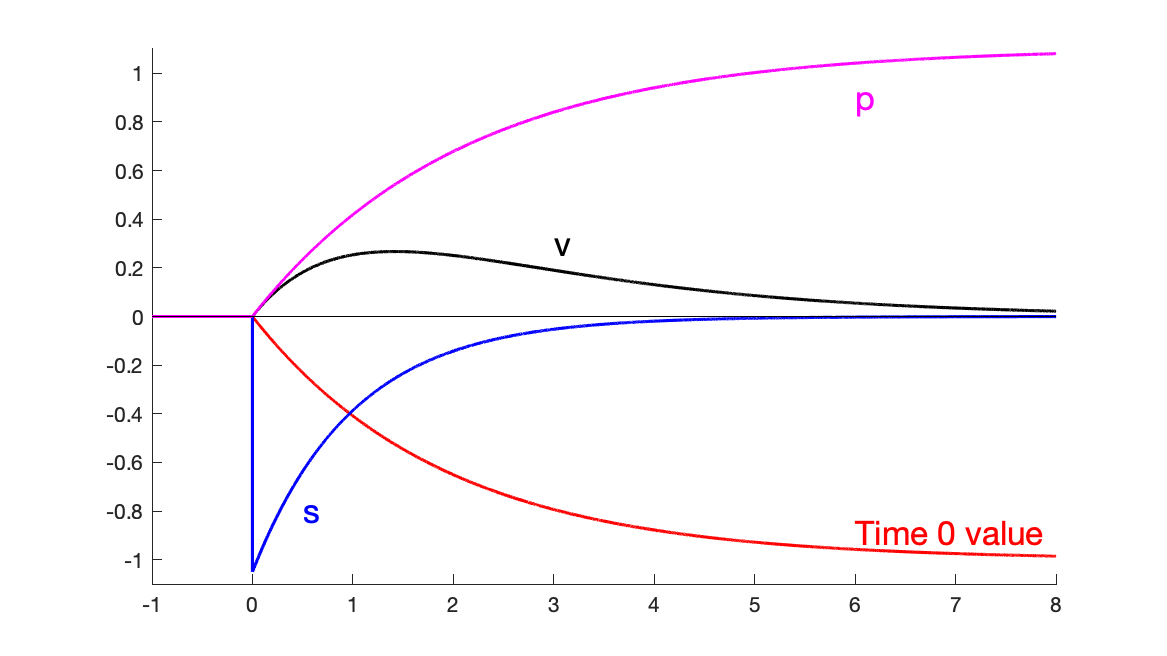
This second graph gives a bit more detail of the fiscal-shock simulation, plotting the primary surplus \(s\), the value of debt \(v\), and the price level \(p\). The surplus follows an AR(1). The persistence of that AR(1) is irrelevant to the inflation path. All that matters is the initial shock to the discounted stream of surpluses. (I make a big fuss in FTPL that you should not use AR(1) surplus process to match fiscal data, since most fiscal shocks have an s-shaped response, in which deficits correspond to larger surpluses. However, it is still useful to use an AR(1) to study how the economy responds to that component of the fiscal shock that is not repaid.)
To see how initial bondholders end up financing the deficits, track the value of those bondholders' investment, not the overall value of debt. The latter includes debt sales that finance deficits. The real value of a bond investment held at time 0, \(\hat{v}\), follows \[d \hat{v}_t = (r \hat{v}_t + i_t - \pi_t)dt. \] I plot the time-zero value of this portfolio, \[e^{-rt} \hat{v}_t.\] As you can see this value smoothly declines to -1%. This is the quantity that matches the 1% by which surpluses decline. (I picked the initial surplus shock \(d\varepsilon_{s,t}=1/(r+\eta_s)\) so that \(\int_{\tau=0}^\infty e^{-r\tau}\tilde{s}_t d\tau =-1.\) )
 |
| Response to interest rate shock at time 0 with no change in surpluses |
The third graph presents the response to an unexpected permanent rise in interest rate. With long-term debt, inflation initially declines. The Fed can use this temporary decline to offset some fiscal inflation. Inflation eventually rises to meet the interest rates. Most interest rate rises are not permanent, so we do not often see this long-run stability or neutrality property. The initial decline in interest rates comes in this model from long-term debt. As the dashed line shows, with shorter-maturity debt inflation rises right away. With instantaneous debt, inflation follows the interest rate exactly.
Again, in this continuous-time model the price level does not move instantly. The higher interest rate sets off a period of lower inflation, not a price-level drop.
With long-term debt the perfect-foresight valuation equation is \[V_{t}=\frac{Q_tB_{t}}{P_{t}}=\int_{\tau=t}^{\infty}e^{-\int_{w=t}^{\tau}\left( i_{w}-\pi_{w}\right) dw}s_{\tau}d\tau. \] where \(Q_t\) is the nominal price of long-term government debt. Now, with flexible prices, the real rate is fixed \(i_w=\pi_w\). With no change in surplus \(\{s_\tau\}\), the right hand side cannot change. Inflation \(\{\pi_w\}\) then simply follows the AR(1) pattern of the interest rate. However, the higher nominal interest rates induce a downward jump or diffusion in the bond price \(Q_t\). With \(B_t\) predetermined, there must be a downward jump or diffusion in the price level \(P_t\). In this way, even with flexible prices, with long-term debt we can see an instant in which higher interest rates lower inflation before ``long run'' neutrality kicks in.
How does the price level not jump or diffuse with sticky prices? Now \(B_t\) and \(P_t\) are predetermined on the left hand side of the valuation equation. Higher nominal interest rates \(\{i_w\}\) still drive a downward jump or diffusion in the bond price \(Q_t\). With no change in \(s_\tau\), a spread \(i_w-\pi_w\) must open up to match the downward jump in bond price \(Q_t\), which is what we see in the simulation. Rather than an instant downward jump in price level, there is instead a long period of low inflation, of slow price level decline, followed by a gradual increase in inflation.
Again, the frictionless model does provide intuition for the long-run behavior of the simulation. The three year decline in price level is reminiscent of the downward jump; the eventual rise of inflation to match the interest rate is reminiscent of the immediate rise in inflation. But again, in the actual dynamics we really have a theory of \emph{inflation}, not a theory of the \emph{price level}, as on impact the price level does not jump at all. Again, the valuation equation generates a path of inflation, of the real interest rate, not a change in the value of the initial price level.
The general lessons of these two simple exercises remain:
Both monetary and fiscal policy drive inflation. Inflation is not always and everywhere a monetary phenomenon, but neither is it always and everywhere fiscal.
In the long run, monetary policy completely determines the expected price level. As the inflation rate ends up matching the interest rate, inflation will go wherever the Fed sends it. If the interest rate went below zero (these are deviations from steady state, so that is possible), it would drag inflation down with it, and the price level would decline in the long run.
One can view the current situation as the lasting effect of a fiscal shock, as in the first graph. One can view the Fed's option to restrain inflation as the ability to add the dynamics of the second graph.
Don't be too put off by the simple AR(1) dynamics. First, these are responses to a single, one-time shock. Historical episodes usually have multiple shocks. Especially when we pick an episode ex-post based on high inflation, it is likely that inflation came from several shocks in a row, not a one-time shock. Second, it is relatively easy to add hump-shaped dynamics to these sorts of responses, by standard devices such as habit persistence preferences or capital accumulation with adjustment costs. Also, full models have additional structural shocks, to the IS or Phillips curves here for example. We analyze history with responses to those shocks as well, with policy rules that react to inflation, output, debt, etc.
The model I use for these simple simulations is a simplified version of the model presented in FTPL 5.7.
$$\begin{aligned}E_t dx_{t} & =\sigma(i_{t}-\pi_{t})dt \\E_t d\pi_{t} & =\left( \rho\pi_{t}-\kappa x_{t}\right) dt\ \\ dp_{t} & =\pi_{t}dt \\ E_t dq_{t} & =\left[ \left( r+\omega\right) q_{t}+i_{t}\right] dt \\ dv_{t} & =\left( rv_{t}+i_{t}-\pi_{t}-\tilde{s}_{t}\right) dt+(dq_t - E_t dq_t) \\ d \tilde{s}_{t} & = -\eta_{s}\tilde{s}_{t}+d\varepsilon_{s,t} \\ di_{t} & = -\eta_{i}i_t+d\varepsilon_{i,t}. \end{aligned}$$
I use parameters \(\kappa = 1\), \(\sigma = 0.25\), \(r = 0.05\), \(\rho = 0.05\), \(\omega=0.05\), picked to make the graphs look pretty. \(x\) is output gap, \(i\) is nominal interest rate, \(\pi\) is inflation, \(p\) is price level, \(q\) is the price of the government bond portfolio, \(\omega\) captures a geometric structure of government debt, with face value at maturity \(j\) declining at \(e^{-\omega j}\), \(v\) is the real value of government debt, \(\tilde{s}\) is the real primary surplus scaled by the steady state value of debt, and the remaining symbols are parameters.
Thanks much to Tim Taylor and Eric Leeper for conversations that prompted this distillation, along with evolving talks.
Whew. The penultimate draft of The Fiscal Theory of the Price Level is now done, and in the hands of the copy-editors at Princeton. There is still time to send me typos, thinkos, wrong equations, excessive repetition and more!

I wrote a short-ish article for the Journal of Economic Perspectives on Fiscal Theory of the Price Level. It tries to summarize the 700 page book in a readable article with no equations. Let me know how I'm doing -- comments most welcome.
I got a chance to see the page proofs of Michael Weisbach's upcoming book, "The Economists' Craft." This leapt out at me from the preface:
A second observation I have made over the years is that, perhaps because of a lack of good advice, many scholars, both doctoral students and faculty members, constantly make the same mistakes. Far too many publicly circulated papers contain incredibly long, mind-numbingly dull literature surveys; introductions that go on and on before they tell the reader what the point of the paper is and why the reader should bother to waste her time on it; data descriptions containing insufficient detail for a third party to replicate the results; tables that are unnecessary, badly labeled, or hard to understand; or overly dry prose written in the passive voice and apparently designed to put the reader to sleep. In addition, many scholars manage their time so badly when giving presentations that they do not get to the main results of their paper until the last five minutes of the talk. Their presentations are often poorly designed, with slides that are incomprehensible or even unreadable owing to their use of fonts so small that participants sitting more than a few rows back cannot read them. Young faculty routinely mismanage their career by not having a coherent research agenda, not getting their papers to journals, or not making connections with people in their field who teach at other universities. Sometimes they do not even bother to show up for seminars in their field at their own university.
So true. This book's contrary advice will be very useful.
I'm giving "A fiscal theory of monetary policy with partially-repaid long-term debt" at the virtual finance theory seminar, Wed Oct 28 at 1 PM EDT. Brett Green leads off with "Due Diligence" at 12 PM EDT. If interested, come join. Warning: this is an academic theory paper whose whole point is to look at equations.
The link has an email address which I don't want to post here, email for a zoom invitation.
This is an excellent seminar series and one of the first of the new international zooms, which are an exciting development. Thanks to Linda Schilling for organizing.
Following my last post on debt I've thought a bit more, and received some very useful emails from colleagues.
A central clarifying thought emerges.
The main worry I have about US debt is the possibility of a debt crisis. I outlined that in my last post, and (thanks again to correspondents) I'll try to draw out the scenario later. The event combines difficulty in rolling over debt, the lack of fiscal space to borrow massively in the next crisis. The bedrock and firehouse of the financial system evaporates when it's needed most.
To the issue of a debt crisis, the whole debate about r<g, dynamic inefficiency, sustainability, transversality conditions and so forth is largely irrelevant.
We agree that there is some upper limit on the debt to GDP ratio, and that a rollover crisis becomes more likely the larger the debt to GDP ratio. Given that fact, over the next 20-30 years and more, the size of debt to GDP and the likelihood of a debt crisis is going to be far more influenced by fiscal policy than by r-g dynamics.
In equations with D = debt, Y = GDP, r = rate of return on government debt, s = primary surplus, we have* \[\frac{d}{dt}\frac{D}{Y} = (r-g)\frac{D}{Y} - \frac{s}{Y}.\] In words, growth in the debt to GDP ratio equals the difference between rate of return and GDP growth rate, less the ratio of primary surplus (or deficit) to GDP.
Now suppose, the standard number, r>g, say r-g = 1% or so. That means to keep long run average 100% debt/GDP ratio, the government must run a long run average primary surplus of 1% of GDP, or $200 billion dollars. The controversial promise r<g, say r-g = -1%, offers a delicious possibility: the government can keep the debt/GPD ratio at 100% forever, while still running a $200 billion a year primary deficit!
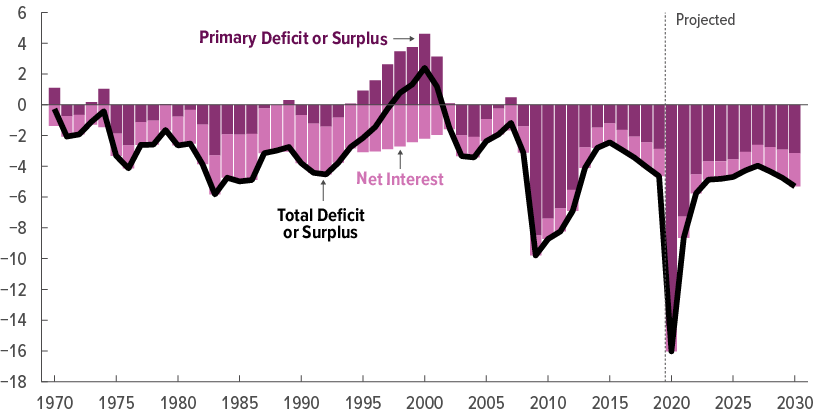
But this is couch change! Here are current deficits from the CBO September 2 budget update
Now that this is clear, I realize I did not emphasize enough that Olivier Blanchard's AEA Presidential Address acknowledges well the possibility of a debt crisis:
Fourth, I discuss a number of arguments against high public debt, and in particular the existence of multiple equilibria where investors believe debt to be risky and, by requiring a risk premium, increase the fiscal burden and make debt effectively more risky. This is a very relevant argument, but it does not have straightforward implications for the appropriate level of debt.
See more on p. 1226. Blanchard's concise summary
there can be multiple equilibria: a good equilibrium where investors believe that debt is safe and the interest rate is low and a bad equilibrium where investors believe that debt is risky and the spread they require on debt increases interest payments to the point that debt becomes effectively risky, leading the worries of investors to become self-fulfilling.
Let me put this observation in simpler terms. Let's grow the debt / GDP ratio to 200%, $40 trillion relative to today's GDP. If interest rates are 1%, then debt service is $400 billion. But if investors get worried about the US commitment to repaying its debt without inflation, they might charge 5% interest as a risk premium. That's $2 trillion in debt service, 2/3 of all federal revenue. Borrowing even more to pay the interest on the outstanding debt may not work. So, 1% interest is sustainable, but fear of a crisis produces 5% interest that produces the crisis.
Brian Riedi at the Manhattan Institute has an excellent exposition of debt fears. On this point,
... there are reasons rates could rise. ...
market psychology is always a factor. A sudden, Greece-like debt spike—resulting from the normal budget baseline growth combined with a deep recession—could cause investors to see U.S. debt as a less stable asset, leading to a sell-off and an interest-rate spike. Additionally, rising interest rates would cause the national debt to further increase (due to higher interest costs), which could, in turn, push rates even higher.
***********
So how far can we go? When does the crisis come? There is no firm debt/GDP limit.
Countries can borrow a huge amount when they have a decent plan for paying it back. Countries have had debt crises at quite low debt/GDP ratios when they did not have a decent plan for paying it back. Debt crises come when bond holders want to get out before the other bond holders get out. If they see default, haircuts, default via taxation, or inflation on the horizon, they get out. r<g contributes a bit, but the size of perpetual surplus/deficit is, for the US, the larger issue. Again, r<g of 1% will not help if s/Y is 6%. Sound long-term financial strategy matters.
From the CBO's 2019 long term budget outlook (latest available) the outlook is not good. And that's before we add the new habit of massive spending.
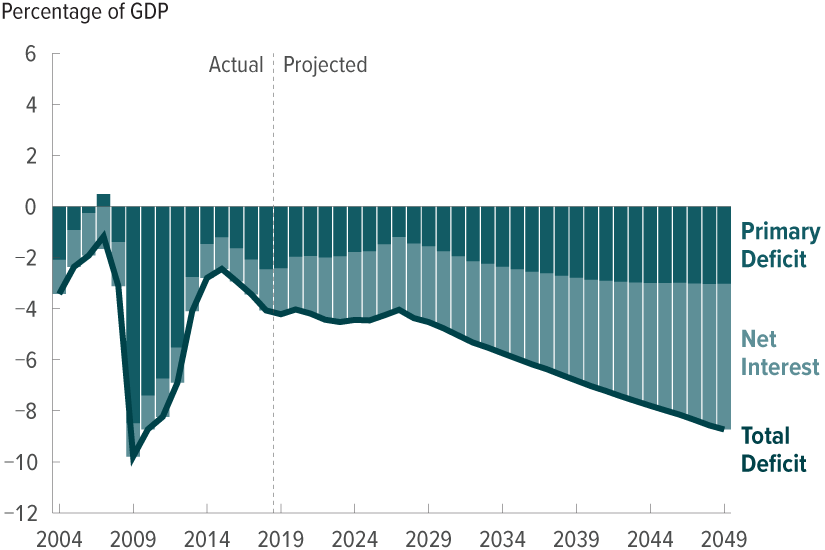

******
Policy.
As Blanchard points out, small changes do not make much of a difference.
a limited decrease in debt—say, from 100 to 90 percent of GDP, a decrease that requires a strong and sustained fiscal consolidation—does not eliminate the bad equilibrium. ...
Now I disagree a bit. Borrowing 10% of GDP wasn't that hard! And the key to this comment is that a temporary consolidation does not help much. Lowering the permanent structural deficit 2% of GDP would make a big difference! But the general point is right. The debt/GDP ratio is only a poor indicator of the fiscal danger. 5% interest rate times 90% debt/GDP ratio is not much less debt service than 5% interest rate times 100% debt/GDP ratio. Confidence in the country's fiscal institutions going forward much more important.
At this point the discussion usually devolves to "Reform entitlements" "No, you heartless stooge, raise taxes on the rich." I emphasize tax reform, more revenue at lower marginal rates. But let's move on to unusual policy answers.
Borrow long. Debt crises typically involve trouble rolling over short-term debt. When, in addition to crisis borrowing, the government has to find $10 trillion new dollars just to pay off $10 trillion of maturing debt, the crisis comes to its head faster.
As blog readers know, I've been pushing the idea for a long time that especially at today's absurdly low rates, the US government should lock in long-term financing. Then if rates go up either for economic reasons or a "risk premium" in a crisis, government finances are much less affected. I'm delighted to see that Blanchard agrees:
to the extent that the US government can finance itself through inflation-indexed bonds, it can actually lock in a real rate of 1.1 percent over the next 30 years, a rate below even pessimistic forecasts of growth over the same period
contingent increases in primary surpluses when interest rates increase.
I'm not quite sure how that works. Interest rates would increase in a crisis precisely because the government is out of its ability or willingness to tax people to pay off bondholders. Does this mean an explicit contingent spending rule? Social security benefits are cut if interest rates exceed 5%? That's an interesting concept.
Or it could mean interest rate derivatives. The government can say to Wall Street (and via Wall Street to wealthy investors) "if interest rates exceed 5%, you send us a trillion dollars." That's a whole lot more pleasant than an ex-post wealth tax or default, though it accomplishes the same thing. Alas, Wall Street and wealthy bondholders have lately been bailed out by the Fed at the slightest sign of trouble so it's hard to say if such options would be paid.
Growth. Really, the best option in my view is to work on the g part of r-g. Policies that raise economic growth over the next decades raise the Y in D/Y, lowering the debt to GDP ratio; they raise tax revenue at the same tax rates; and they lower expenditures. It's a trifecta. In my view, long-term growth comes from the supply side, deregulation, tax reform, etc. Why don't we do it? Because it's painful and upsets entrenched interests. For today's tour of logical possibilities if you think demand side stimulus raises long term growth, or if you think that infrastructure can be constructed without wasting it all on boondoggles, logically, those help to raise g as well.
********
*Start with \(\frac{dD}{dt} = rD - s.\) Then \( \frac{d}{dt}\frac{D}{Y} = \frac{1}{Y}\frac{dD}{dt}-\frac{D}{Y^2}\frac{dY}{dt}.\)
***
Update: David Andolfatto writes, among other things,
"Should we be worried about hyperinflation? Evidently not, as John does not mention it"
For these purposes, hyperinflation is equivalent to default. In fact, a large inflation is my main worry, as I think the US will likely choose default via inflation to explicit default. This series of posts is all about inflation. Sorry if that was not clear.
also
Is there a danger of "bond vigilantes" sending the yields on USTs skyward? Not if the Fed stands ready to keep yields low.
All the Fed can do is offer overnight interest-paying government debt in exchange for longer-term government debt. If treasury markets don't want to roll over 1 year bonds at less, than, say, 10%, why would they want to hold Fed reserves at less than 10%? If the Fed buys all the treasurys in exchange for reserves that do not pay interest, that is exactly how we get inflation. And mind the size. The US rolls over close to $10 trillion of debt a year. Is the Fed going to buy $10 trillion of debt? Who is going to hold $10 trillion of reserves, who did not want to hold $10 trillion of debt.
In a crisis, even the Fed loses control of interest rates.

"big airlines will receive 70% of the money as grants—which won’t be paid back—and 30% as loans. The cash comes with strings attached: Airlines must give the government warrants amounting to 10% of a given loan’s value that can be swapped for stocks; they cannot lay off staff until September; and they face restrictions on dividends, buybacks and executive compensation."Oh, and as the article makes clear, this only gets us maybe through the summer. Anyone want to take a bet that planes are full again by September?
"By eliminating much of the risk that eligible issuers will not be able to repay investors by rolling over their maturing commercial paper obligations, this facility should encourage investors to once again engage in term lending in the commercial paper market. "Why are companies borrowing long term by rolling over commercial paper? Didn't we learn anything about rolling over short term debt in 2008? Are we going to follow up by putting a stop to that? Why don't companies have more equity financing, on which they can just stop paying dividends?
The PDCF will offer overnight and term funding with maturities up to 90 days...Credit extended to primary dealers under this facility may be collateralized by a broad range of investment grade debt securities, including commercial paper and municipal bonds, and a broad range of equity securities.Let's translate. You're the trading desk at, say Goldman Sachs. You want to buy stocks, as you think people are dumping in a hurry. Great, that's what traders are supposed to do: "provide liquidity." But, sadly, you're in the habit of of funding trading activity by borrowing money, short term. And you can't do that right now. So the Fed will now lend you the money to buy stocks, and will take the stocks as collateral! It's almost as if the Fed is buying stocks -- except you get the gains, and if you go under, the Fed gets the stocks! (A friend in the securities industry say nobody is bothering to investigate and price high grade corporates. The Fed is setting the prices.)
the Primary Market Corporate Credit Facility (PMCCF) for new bond and loan issuance and the Secondary Market Corporate Credit Facility (SMCCF) to provide liquidity for outstanding corporate bonds.Translation: The Fed will buy new corporate bonds, thus directly lending to corporations. And it will buy outstanding bonds.
