Today I begin a three part series exploring interest rates and inflation. (Part 2 empirical work, Part 3 theory)
How does the Fed influence inflation? Is the recent easing of inflation due to Fed policy, or happening on its own? To what extent should we look just to the Fed to bring inflation under control going forward?
The standard story: The Fed raises the interest rate. Inflation is somewhat sticky. (Inflation is sticky. This is important later.) Thus the real interest rate also rises. The higher real interest rate softens the economy. And a softer economy slowly lowers inflation. The effect happens with "long and variables lags," so a higher interest rate today lowers inflation only a year or so from now.
interest rate -> (lag) softer economy -> (lag) inflation declines
This is a natural heir to the view Milton Friedman propounded in his 1968 AEA presidential address, updated with interest rates in place of money growth. A good recent example is Christina and David Romer's paper underlying her AEA presidential address, which concludes of current events that as a result of the Fed's recent interest-rate increases, "one would expect substantial negative impacts on real GDP and inflation in 2023 and 2024."
This story is passed around like well worn truth. However, we'll see that it's actually much less founded than you may think. Today, I'll look at simple facts. In my next post, I'll look at current empirical work, and we'll find that support for the standard view is much weaker than you might think. Then, I'll look at theory. We'll find that contemporary theory (i.e. for the last 30 years) is strained to come up with anything like the standard view.
Here's the history of interest rates and inflation. We're looking to see if high real interest rates push inflation down.
There is a bit of a fudge factor: Theory wants to measure real interest rates as interest rate less expected future inflation. But in the standard story expected inflation is pretty sticky, so interest rates relative to current inflation will do. You can squint at next year's actual inflation too.
1980-1982 is the poster child for the standard view. Inflation peaked at 15%. Interest rates went to 20%, and for two years interest rates stayed above inflation and inflation declined. There was a severe recession too.
There weren't visible "long and variable" lags, however. Inflation started going down right away. Eyeballing the graph, it looks pretty much like real interest rates push inflation down immediately, with no additional lagged effect. (One can find more of a lag from interest rate shocks, but then there is a question whether the shock has a lagged effect on the economy, or whether the higher interest rates that follow the shock affect the economy when they happen. Here we're just looking at interest rates. I'll come back to this issue next time discussing VARs.)
Is this a routine pattern or one data point? If one data point, it's much more likely something else was involved in the 1980s disinflation (fiscal policy!) at least in addition to the standard story. The rest of the graph is not so comforting on this point.
In the standard story, the 1970s saw inflation spiral up because the Fed kept interest rates too low. Real interest rates are about zero throughout the 1970s. But the big story of the 1970s is the three waves of inflation - four if you count 1967. There is little in this pattern that suggests low real interest rates made inflation take off, or that high real interest rates brought inflation back down again. The interest rate line and inflation line are practically on top of each other. The standard story is told about the 1970s, waves of monetary stimulus and stringency, but it's hard to see it in the actual data. (1970 conforms a bit if you add a one year long-and-variable lag.)
Now, you may say, those bouts of inflation were not due to Fed policy, they came from somewhere else. The standard story talks about "supply shocks" maybe, especially oil prices. (Fiscal shocks? : ) ) Perhaps the recessions also came from other forces. But that is a lot of my point -- inflation can come from somewhere else, not just the Fed.
Moreover, the easing of inflation in the big waves of the 1970s did not involve noticeably high real interest rates.
It's a historical precedent that ought to worry us now. Three times inflation came. Three times, inflation eased, with recessions but without large real interest rates. Three times inflation surged again, without obviously low real interest rates.
The correlation between real interest rates is also tenuous in the 1980s and beyond. Once inflation hit bottom in 1983, there is a decade of high interest rates with no additional inflation decline. Once again, you can cite other factors. Maybe strong supply side growth raises the "neutral" interest rate, so what counts as high or low changes over time? That's why we do real empirical work. But it would be nicer if we could see things in the graph.
The 2001 recession and inflation drop is preceded by slightly higher interest rates. But also slightly higher inflation so there isn't a big rise in real rates, and the real rates had been at the same level since the early 1990s. There is a little period of higher real interest rates before the 2008 recession, which you might connect to that recession and disinflation with a long and variable lag. But in both cases, we know that financial affairs precipitated the recessions, not high values of the overnight federal funds rate.
Then we have negative real interest rates in the 2010s, but inflation goes nowhere despite central banks explicit desire for more inflation. This looks like the 1980s in reverse. Again, maybe something else got in the way, but that's my point today. Higher interest rates controlling inflation needs a lot of "something else," because it doesn't scream at you in the data.
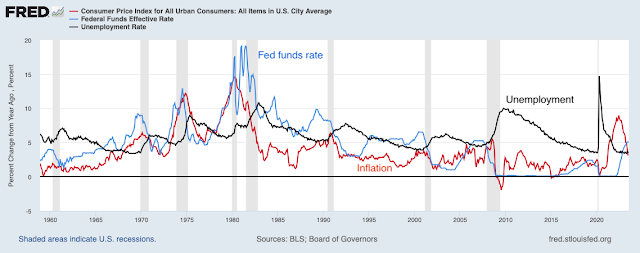
Here, I add unemployment to the graph. The standard story has to go through weakening the economy, remember. Here you can see something of the old Phillips curve, if you squint hard. Higher unemployment is associated with declining inflation. But you can also see if you look again why the Phillips curve is elusive. In many cases, inflation goes down when unemployment is increasing, others when it is high. In most cases, especially recently, unemployment remains high long after inflation has settled down. So it's a more tenuous mechanism than your eye will see. And, remember, we need both parts of the mechanism for the standard story. If unemployment drives inflation down, but higher interest rates don't cause unemployment, then interest rates don't affect inflation via the standard story.
That brings us to current events. Why did inflation start, and why is it easing? Will the Fed's interest raises control inflation?
Inflation took off in February 2021. Yes, the real interest rate was slightly negative, but zero rates with slight inflation was the same pattern of recent recessions which did nothing to raise inflation. Unemployment, caused here clearly by the pandemic not by monetary policy, rose coincident with the decline in inflation, but was still somewhat high when inflation broke out, so a mechanism from low real rates to low unemployment to higher inflation does not work. Up until February 2021, the graph looks just like 2001 or 2008. Inflation came from somewhere else. (Fiscal policy, I think, but for our purposes today you can have supply shocks or greed.)
The Fed did not react, unusually. Compare this response to the 1970s. Even then, the Fed raised interest rates promptly with inflation. In 2021, while inflation was rising and the Fed did nothing, many people said the standard story was operating, with inflation spiraling away as a result of low (negative) real interest rates.
But then inflation stopped on its own and eased. The easing was coincident with the very few first interest rate rises. Only last April 2023 did the Federal funds rate finally exceed inflation. By the conventional story -- 1980 -- only now are real interest rates even positive, and able to have any effect. Yet inflation eased a full year earlier, with interest rates still far below inflation.
Moreover, unemployment was back to historic lows by 2022. Whatever the Fed is doing, it is manifestly not slowing the economy. Neither the high real interest rate, by conventional measure, nor the mechanism of softer economy is present to lower inflation. It's really hard, via the standard story, to credit the Fed with the easing of inflation while interest rates were lower than inflation and unemployment below 4%. Though, certainly, in the standard story they were no longer making things worse.
Of course, now, analysts depart from the standard story. A lot of commentary now just ignores the fact that interest rates are below inflation. The Fed raised "interest rates," we don't talk about nominal vs. real, and proclaim this a great tightening. A bit more sophisticated analysis (including the Fed) posits that expected inflation is much lower than past inflation, so that real interest rates are much higher than the graph shows. Maybe by raising rates a little bit and giving speeches about its new philosophy, quietly abandoning flexible average inflation targeting, the Fed has re-established important credibility, so that these small interest rate rises have a big effect on expectations.
Indeed, there is lots of thinking these days that has the Fed act entirely through expectations. In the modern Phillips curve, we think of
inflation today = expected inflation next year + (coefficient) x unemployment (or output gap)
With this view, if speeches and signals can bring down expected inflation, then that helps current inflation. Indeed, most estimates pretty much give up on the last term, "coefficient" is close to zero, the Phillips curve is flat, unemployment goes up and down with very little change in inflation.
That has led many to think the Fed acts mainly through expectations. Speeches, forward guidance, "anchoring," and so forth move the expected inflation term. There is a logical problem, of course: you can't just talk, eventually you have to do something. If the coefficient is truly zero and the Fed's actions have no effect on inflation, then speeches about expectations have eventually to be empty.
This is a quite different view than the "standard story" that we are looking at, though most commentators don't recognize this and offer both the standard story and this Phillips curve at the same time. Theory post #3 will explore the difference between this current view of the Phillips curve and the standard story. Note that it really does say lower expected inflation or higher unemployment bring inflation down now. Now means now, not a year from now -- that's the expected inflation term. Higher unemployment brings down inflation now, and inflation is then less than expected inflation -- higher unemployment makes inflation jump down and then rise over time. Post #3 will cover this sharp difference and the many efforts of modelers to make this modern Phillips curve produce something like the standard story, in which higher interest rates make inflation go down over time.
In sum, the standard story is that high interest rates soften the economy, with a lag, and that lowers inflation, also with a lag; and that interest rate policy is the main determinant of inflation so the Fed has main responsibility for controlling inflation. This story has not much changed since Milton Friedman in 1968, except with interest rates in place of money growth. 1980-1982 is the main episode interpreted that way. But it's very hard to see this standard story by looking at the data in any other time period, and there are many periods that contradict the standard story. The modern Phillips curve tells a sharply different story.
So much for looking at graphs. We should look at real empirical work that controls for all those other forces. That's the next post. We should look at theory more carefully, to see if the standard story survives all the changes in economics since Milton Friedman's justly famous address and the similar ISLM models of the 1970s which still pervade policy thinking.
Update:
A clarification, thanks to conversations with my most faithful and accurate correspondent: The point of this post, and the series is not to claim that high interest rates don't lead to falling inflation, with long and variable lags. The point is that we don't really know, that the theory and evidence behind this cherished verity are much less strong than most people and most economists think. Uncertainty does not sell well in the blogosphere and public debate, but it is important. When you think about the future, and about appropriate policy, your priors on how things work should be much wider than they likely are. Perhaps the thing that "expertise" or 40 years of studying something really can certify is when I don't know, but I know for sure nobody else does either! So buckle your seatbelt and brace yourself for uncertainty.


!. The "long & variable" lags are a myth related to interest rates, which don´t define the stance of monetary policy!
ReplyDeletehttps://marcusnunes.substack.com/p/there-are-no-lags-in-effect-of-monetary
The distributed lag effect of money flows, are mathematical constants. That's how I predicted both the flash crash in stocks and the flash crash in bonds, 6 months in advance and within one day. Go Fish.
DeleteDo you disagree with the general prop that inflation is related to some measure of capacity? And separately, is it useful to distinguish between core (ex. F&E or some outlier-exclusion measure) and headline inflation when appraising how sticky prices respond to a demand or supply shock?
ReplyDeleteThis only covers your "recent period". There´s no mention of interest rates (or fiscal policy). Nevertheless, the fall, rise & fall again pattern of inflation can be "fully accounted for"!
ReplyDeletehttps://marcusnunes.substack.com/p/post-c-19-inflation-the-story-of
The standard story is so bad, it makes me want to cry every time I hear it. Can you imagine if a physicist said that loud noises cause objects to fall to earth, after a long and variable lag? It was a loud noise from three years ago that caused that baseball to fall to earth, and those satellites will fall eventually if we make enough loud noises. If after a lot of noise the satellite is still up there, well, just wait a little longer, the lag was longer than we expected.
ReplyDeleteOh come on. Any theory involving "long and variable lags" should be disqualified right there.
The alternative is so simple, it boggles the mind why the profession has been so confused for so long. Total nominal spending today depends on each market participant's expectations of their future nominal income. The Fed or the fiscal authority can alter nominal income expectations, and that will affect nominal spending immediately. Inflation arises when total nominal spending exceeds real production at the current price level. Interest rates are an epiphenomenon, and do not cause or prevent inflation.
There are many ways the Fed or the fiscal authority can alter nominal income expectations, for example by announcing policy changes around the creation and destruction of base money, or by announcing a change in future tax rates, or by announcing a program to give away lots of COVID "loan" money.
Why is this so hard?
We are, as Scott Sumner says, in a dark age of macroeconomics, with so many in the profession so deeply confused about foundational principles.
I agree with most of your sentiments, but since prices are just information, then having lags in action and reaction is understandable when a shock occurs.
DeleteEmpirically price adjustments that trend show this. You can think of housing prices going up m/m or interest rates adjusting for several months in a row
A better look at employment would be this (rather than unemployment rate):
ReplyDeletehttps://fred.stlouisfed.org/series/LNS12300060
1950 - 61%
1960 - 66%
1970 - 70%
1980 - 74%
1990 - 80%
2000 - 81%
Since that time it has fluctuated between 70% and 80%.
Basically we are ALL flying blind and clueless to how inflation works. Future expectations of disinflation NOW could very easily followed by sharp bout of reflation over the next few years; especially as the current White House pursue an out of control fiscal policy.
ReplyDeleteDoes the 1980s data point look more like the 70s when adjusting for changes in weights and treatment of housing, per Summers: https://www.nber.org/papers/w30116
ReplyDeleteEconomists flunked accounting. The distributed lag effect of money flows, the volume and velocity of money, are mathematical constants, and have been for over a century.
ReplyDeleteOne OLS regression model was analyzed using MS Excel's LINEST function on the full data set for 1978-Jan-01 through 2023-June-01. There was no improvement obtained when the data set was censored on the left.
ReplyDeleteModel: Y(t) = B0 + B1.X1(t) + B2.X2(t) + Error(t)
Y(t) = CPI year-year change, annualized, CPIAUCSL
X1(t) = Univ. of Michigan survey of expected inflation one-year ahead
X2(t) = Unemployment rate, UNRATE
B2 B1 B0
Coefficients -0.113 1.570 -1.339
SE. Estimate 0.028 0.030 0.199
R^2 ; SEY 0.837 1.134
F-stat; DOF 1395 543
SSE.Reg.; SSE.Res 3587 698
T-statistics -4.1 52.8 -6.7
Caveat: The the price level and expected inflation rate data are monthly observations, at annualized (year-over-year) rates.
Chart URL: https://fred.stlouisfed.org/graph/?g=17CTO
Sources:
Y(t) ~ U.S. Bureau of Labor Statistics, Consumer Price Index for All Urban Consumers: All Items in U.S. City Average [CPIAUCSL], retrieved from FRED, Federal Reserve Bank of St. Louis; https://fred.stlouisfed.org/series/CPIAUCSL, August 6, 2023.
X1(t) ~ University of Michigan, University of Michigan: Inflation Expectation [MICH], retrieved from FRED, Federal Reserve Bank of St. Louis; https://fred.stlouisfed.org/series/MICH, August 6, 2023.
X2(t) ~ U.S. Bureau of Labor Statistics, Unemployment Rate [UNRATE], retrieved from FRED, Federal Reserve Bank of St. Louis; https://fred.stlouisfed.org/series/UNRATE, August 6, 2023.
Discussion: Filtering the noise component using a low-pass box-car averaging filter will enhance the signal:noise ratio, but at a cost vis-a-vis fidelity. Because of the simple linear form of the regression model, noting that UNRATE (X2(t)) is always positive, a revised model can be devised, e.g., Z(t) = [Y(t) - X1(t)] / X2(t), that enables the model to be tested by hypothesis: H0 ~ Z(t) = D0, a constant, H1 ~ Z(t) = D0 + D1.t + D2.t^2 + Error(t), etc. When the data set is censored on the left, H0 is accepted.
There has been a huge underinvestment in mining for years. The result will be much higher commodity prices regardless of anything Central banks do.
ReplyDeleteThe Western countries attacks on agriculture are batshit crazy - all to reduce the temperature by .0006% or whatever. That will cause much higher agricultural prices regardless of what Central Banks do.
There is a shortage of middle distillates due to dumb government policies. You make jet fuel and diesel of those. These energy costs will rise very quickly and Central Banks have no control over that.
Government regulations are virtually all business destroyers at the margin. Government is subsidizing wasteful, inefficient solar and wind power while simultaneously making it impossible to mine the metals necessary to make electrification grow and that is besides the ignorant objection to nuclear power.
Inflation is a lot more than just the Fed Funds Rate and Fed balance sheet maneuvers.
Key: Watch prices in Blue States will crazy regulations. I mean it's no surprise right now that gasoline is $1.00 higher to $2.00 higher a gallon in California and this type of insanity has a long, long way to go. All you have to do is listen to and watch Governors Pritzker and Newsome to see where this is all going.
We are in for a hell of a ride.
Been a real-world student of this particular issue for about 15 years, and am surprised that Economics (as a discipline) still gets so much so badly wrong here. (1) The original Phillips curve was a relationship between unemployment and real wages. Not consumer prices. The form of Phillips taught in current textbooks is demonstrably wrong, as hinted by the data shown in the original post. For more info, see John Hussman's work on this topic... from many years ago. (2) The "Long and variable lags" spiel is even more laughably unscientific. There was no lag in the ignition of consumer price inflation in 2021, and it wasn't interest rates that started it - why should rates fix it? (3) Items 1 and 2 also suggest that Economics (as a discipline) must face substantial disincentives to scientific truth-finding, because errors of that significance shouldn't persist. And yet instead we see that they are reinforced as dogma. (4) In every prior attempt to suppress inflation, both credit supply and interest rates changed together - the system in place at the time required QT to force up interest rates (very tight correlation, again see Hussman's work over the years). Only in the current inflation episode have credit supply and rates been decoupled, via Interest on Reserves. To force up interest rates under the previous regime, the Fed would have needed to aggressively sell down a large fraction of its balance sheet. Instead today we have interest rate price controls and gentle balance sheet runoff. This is a policy-regime change on par with abandoning the gold standard, yet few people appear to appreciate this. Interest on Reserves didn't exist in prior inflation episodes and is is a massive taxpayer-funded subsidy to holders of reserves - since absent those payments the Federal Reserve would be remitting the same funds back to the US Treasury. And in the absence of meaningful credit-supply reduction (QT), rising rates alone don't seem to curb inflation by diminishing overall economic activity.
ReplyDeleteThis is a very good comment, and an issue on my mind. All contractions before 2008 involved some sort of money supply restriction, less lending, credit constraint, and so forth. Now we simply raise the interest rate, but until a crisis hits that has no real impact on the flow of credit or quantity of liquid assets. Will it have the same effect? Or, why does it seem to have no effect? Really important. I don't agree that IOR is a taxpayer subsidy. Interest is what it takes people to hold bonds. The interest on reserves flows through from interest on treasurys. Yes, the Fed shortened the maturity structure so interest costs on the debt hit faster, but that's a second order issue.
DeleteIf one is prepared to entertain Irving Fisher's 'Quantity Theory' (1911), and engage in a thought-experiment ("gedankenexperiment", Karl Shell, M.I.T.), then differentiating M v = P y totally gives pi(t) + g(t) - m'(t) - v'(t) = 0, where pi(t) = (dP/P)(t), g(t) = (dy/y)(t), m'(t) = ((dM/dt)/M)(t), and v'(t) = ((dv/dt)/v)(t).
DeleteThe data graphing application "FRED" provided by the Fed. Res. Bank of St. Louis, provides a convenient and efficient vehicle for a first-cut test of the hypothesis. What is found by charting the model output versus calendar time is that the period 2020-2023 is significantly different monetary and fiscal policywise from the pre-2020 period.
Model: g + pi - m'(t) - v'(t) = error.
The result is dramatically shown in the following chart which illustrates the extent of the divergence of policy from recent historical patterns.
https://fred.stlouisfed.org/graph/?g=17G9p
Whatever the criticisms brought against Fisher's 'Quantity Theory' have been in the past, the 2020-2023 period compared to the pre-2020 should motivate a re-evaluation of those criticisms.
Similar to the original commentator, as a practical observer of economics point number 3 is important. A large part of the problem is that macro does not focus enough on finance and accounting which is how the real world works. No one is taking actions based on "real" output, everyone lives in a nominal world. Therefore, macro puts too much emphasis on CPI and not enough on asset prices, balance sheets and income statements. This difference is perhaps why John disagrees with your focus on QT. In all fairness, the Fed also itself does not understand QE and QT- look at how many MBS they bought when HPA was up 20% y/y and inflation was > 5%
DeleteHmmmm....
DeleteCorrect measure of inflation for this type of exercise is GDP deflator (not consumer price index).
https://fred.stlouisfed.org/graph/fredgraph.png?g=17Y0J
M2 * Velocity of M2 = Real GDP * GDP Deflator / 100
How do you believe any information numbers if you simply observe. As a small business owner all my material and sub labor has literally doubled since 2021. Same goes with fuel. Electricity and gas have almost doubled and most food has too. My small weapons to neutralize this has been to increase our rates, but so has our labor. We have successfully fought this by trimming down and paying down debt.
ReplyDelete