(This post is an interlude between history and VARs)
Jesper Rangvid has a great blog post today on different inflation measures.
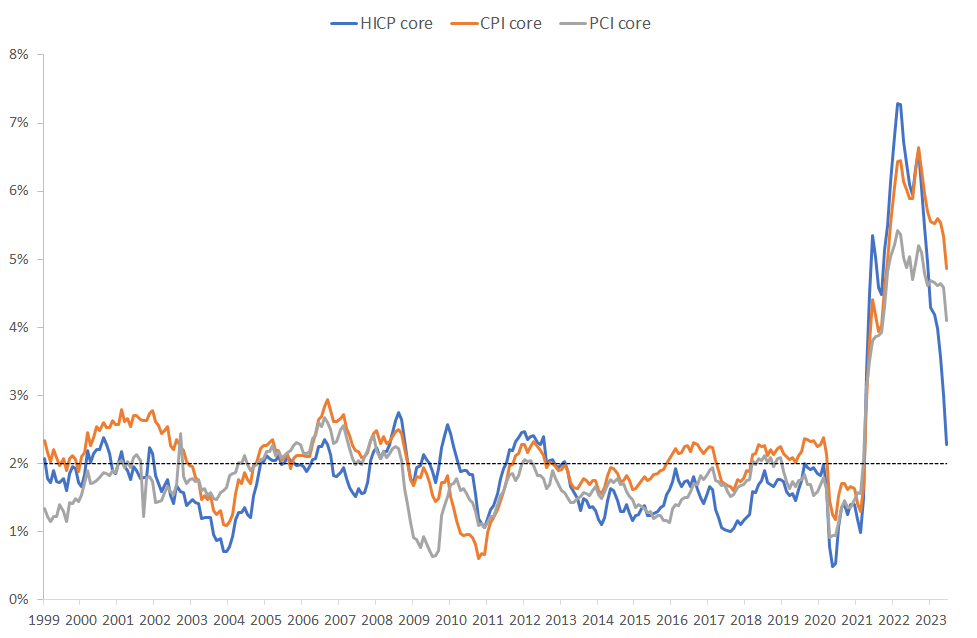
CPI and PCE core inflation (orange and gray) are how the US calculates inflation less food and energy, but including housing. We do an economically sophisticated measure that tries to measure the "cost of housing" by rents for those who rent, plus how much a homeowner pays by "renting" the house to him or herself. You can quickly come up with the plus and minus of that approach, especially for looking at month to month trends in inflation. Europe in the "HICP core" line doesn't even try and leaves owner occupied housing out altogether.
Jesper's point: if you measure inflation Europe's way, US inflation is already back to 2%. The Fed can hang out a "mission accomplished" banner. (Or, in my view, a "it went away before we really had to do anything serious about it" banner.) And, since he writes to a European audience, Europe has a long way to go.
A few deeper (and slightly grumpier) points:
Notice just here how different measures of inflation broadly correlated, but are 1-2% different from each other. Well, inflation is imprecisely measured. Get used to that and stop worrying too much about anything past the decimal point.
All this business about core vs. headline, hosing vs nonhousing, PCE vs. CPI, inflation is fine all except for three categories, and so forth is a bit confusing. In the end, inflation is inflation, and all goods matter. You pay for food, energy, and housing. So why ignore these? Why not use the most comprehensive measure always? The best number we have for the overall rise of the cost of living in the US is the full PCE, including all households, and food, energy, and housing. Inflation is not over and the mission not accomplished until it is over, and that includes food energy and housing. Why is it not just sophistry to say "well, inflation is back to 2% except for food energy and housing, so the fight is over?" "Every ship but your four fastest" is not "every ship."
The usual (implicit) argument is that core inflation is a better predictor of overall inflation a year from now than is today's full inflation. Food and energy prices have upward and downward spikes that predictably reverse themselves. The argument must be similar for leaving out imputed rents. There are predictable housing price dynamics in how house prices and rents feed into each other, and how rents on new leases propagate to rents of old ones when they roll over. That one might have some behavioral argument that households being both landlord and tenant don't feel the pain and don't adjust behavior as quickly in response to opportunity costs as renters do to out of pocket costs. But that should be reflected in what you do with the number rather than leaving it out of the data.
More generally, why do people indulge in this economist nerd pastime of slicing and dicing inflation to what went up and what went down and how might it be different if we left this or that out? Figuring out what it means for overall inflation in the future is the only reason I can see for it. (Perhaps figuring out whose inflation went up or down more than someone else's is also a reason to do it.)
But this ought to be a lot more rigorous. If the point is, we look at core today because core is a better forecast of inflation a year from now than inflation today, let's see the regression evidence. Is it true that
All goods and services inflation a year from now = a + b x Core inflation today + error
produces a better forecast than
All goods and services inflation a year from now = a + b x All goods and services inflation today + error?
That is not the exact regression you'd run, of course. I might start with
PCE (t+1) = a + b x PCE(t) + c x (Core(t)-PCE(t)) + error.
And we want to include other variables really. If the game is to forecast PCE a year from now, then you want an appropriate kitchen sink on the right hand side, up to overfitting. Just how important is core vs. pce in that kitchen sink? How much does looking at all the various components of inflation help to forecast inflation? Let's put those expiring lease dynamics in to forecast housing inflation, explicitly.
I suspect the answer is that all of this does not help much. My memory of Jim Stock and Mark Watson's work on forecasting inflation with lots of right hand variables is that it's really hard to forecast inflation. But that was 20 years ago.
So I'll leave this as a question for commenters. How can we best forecast inflation? How does looking at various components of inflation help you to forecast the overall quantity? This must be a question with a well established answer, no? Send your favorite papers in the comments. (If you can't get blogger's horrible comment system to work send email.)
If not, it's today's suggestion for low hanging fruit paper topic! How looking at components does or does not help to forecast overall inflation is a really important question.
A last comment: People look at all the various components of inflation, but don't ever (that I have seen) cite forecasting overall inflation as the explicit question. They quite often say that the component view suggests inflation is or isn't going to rise in the future, so I'm imputing this as the question. If not, what is the question? Why are we looking at components? In so many areas, it's interesting that people so seldom state the question to which they proffer answers.
Update:
Why be lazy? I know how to run regressions. Sample 1960:1-2023:6, monthly data, forecasting one-year inflation from lagged one-year inflation, overlapping data with Newey-West corrected t statistics, 24 lags. I include a constant in each regression, omitted in the table. Fred series fedfunds, cpilfesl, cpiaucsl.
| CPI | Core | Core-CPI | Core-CPI level | R2 |
|---|---|---|---|---|
| 0.74 | 0.55 | |||
| (7.19) | ||||
| 0.77 | 0.47 | |||
| (5.55) | ||||
| 0.76 | -0.02 | 0.55 | ||
| (2.42) | (-0.05) | |||
| 0.74 | -0.02 | 0.55 | ||
| (6.09) | (-0.05) | |||
| 0.77 | 0.04 | 0.55 | ||
| (8.11) | (0.79) |
Row 1, inflation is forecastable by lagged inflation with an 0.74 AR(1) coefficient. That Fed dot plots always look like an AR(1) with an 0.74 coefficient is pretty sensible. Row 2, core inflation also forecasts inflation. But the R2 is lower. Inflation forecasts itself better than core. Row 3, in a multiple regression, core does nothing to help to forecast inflation. Row 4, the difference between core and inflation does nothing to forecast inflation. Row 5, to capture long term trends and transitory inflation, you might think that the difference between the core and headline CPI levels helps to forecast CPI inflation. Nope.
This is way worse than I thought. I thought Core would help a bit. I believed that food and energy would have temporary variation which core would tell us to ignore. Perhaps the standard "supply shock" story has some merit. Food or energy goes up because of a supply shock. The Fed or fiscal policy then accommodates the supply shock with more demand, so that wages and other prices catch up with the headline rather than making headline go back down again.
Update:
A good blog post making the case that core is better. Two important differences: 1) Sample restricted to after 1983, so not evaluating its use during the one big inflation and disinflation 2) Pure number, no regression. I.e. how does measure x forecast inflation, not a + b x measure x.
Also a good Jason Furman tweet
I graphed three semiannual inflation measures which at least exclude lagged and dubious estimates of "Owners Equivalent rent" (HICP) or both OER and lagged survey of rents on old and new leases (CPI less rent and the PPI for final demand).
ReplyDeleteOne of them is remarkably close to 2% for the first half of 2023 and the other two are below 2%. PPI inflation in the first half was 0.6%.
https://twitter.com/AlanReynoldsEcn/status/1685354980864122882
> How can we best forecast inflation?
ReplyDeleteYou asked, so:
1. Forecast real growth. In the absence of some major shift, like a war or a sudden ban on immigration or a pandemic, trend real growth is a good estimate.
2. Forecast NGDP, using a prediction market (NGDP futures).
3. Forecast inflation as #2 minus #1.
You may wish to forecast inflation (or future NGDP) without a prediction market, but good luck with that. Sorry, but none of us are smart enough to incorporate all of the factors, and any factor, including factors we haven't ever thought of before, may dominate at any point in time. The markets will figure this out much better than any of us.
This is why the Fed should commit to a future path of NGDP, declaring that hitting this NGDP path is the best way to satisfy its dual mandate, and then do whatever it takes to hit it, using a prediction market as a guide. This approach would stabilize nominal spending, which is the best way to stabilize the economy, making the best tradeoff between full employment and price growth that we know how to make --- it does not necessarily always hit 2% inflation or 4% unemployment, but when it fluctuates, it does so in a way that avoids disasters like the price growth of the 1970's or the employment collapse of 2009.
I understand that my comment here holds no credibility but your suggestion sounds like the most sensible considering most well run enterprises would set profitability targets in a similar manner. I agree.
DeleteThe reason the Fed should set aside BLS estimates of rent and the problematic Owners' Equivalent Rent, is because the reported data is unquestionably wrong. It arrives 12-18 months too late, thus understating inflation in 2021 and overstating it since mid-2022.
ReplyDeleteShelter (OER & rent) accounts for 42% of Core CPI, which is another good reason to not take Core CPI seriously.
There is no good argument for excluding food and energy, except that the Fed has sometimes overreacted to global shocks to crude oil prices (which are always temporary, if not transitory).
It has never been convincingly demonstrated that Core measures of inflation predict all-items inflation even one month ahead, much less on a trend basis. This is just an assertion reporters repeat carelessly, without evidence.
https://www.aier.org/article/we-are-measuring-inflation-all-wrong-non-housing-inflation-is-very-low/https://www.aier.org/article/we-are-measuring-inflation-all-wrong-non-housing-inflation-is-very-low/
OLS regression (suggested by JHC)
ReplyDeleteY(t+1) = B0 + B1.Y(t) + B2.X(t) + Error1(t)
B2 = c B1 = b B0 = a
COEFFICIENTS 0.0529 0.8610 0.5786
Std. Error Est.0.0587 0.0250 0.1805
R^2 ; SEY 0.7654 1.4942 #N/A
F-stat.; Deg. Of Freedom 766.8430 470.0000 #N/A
SSE.reg.; SSE.res. 3424.2816 1049.3754 #N/A
#N/A #N/A #N/A
#N/A #N/A #N/A
T-stat 0.9024 34.4480 3.2052
OLS regression (AR1)
Y(t+1) = C0 + C1.Y(t) + Error1(t) C1 = b' C0 = a'
COEFFICIENTS 0.871 0.683
Std. Error Est. 0.022 0.138
R^2; SEY 0.765 1.494
F-stat.; DOF 1533.5 471
SSE.reg.; SSE.res. 3422. 1051.
T-stat 39. 4.9
It's now been a very long time since I've done applied econometrics, It has a first reaction solution to the kitchen sink problem with right hand variables, couldn't you use regularization?
ReplyDeleteAlso, couldn't you smooth out seasonal or irregular patterns in CPE to get around that bit of an issue?
You are too kind to the core inflationers. Why would any component of a price index be good at forecasting the whole index? Washing machine prices anybody? Even Aristotle said that you can't explain a phenomenon with its components. How much more time do we need?
ReplyDeleteWhat's going on with that, which rests on a theory of stickier prices, perpetuates the confusion between a change in relative prices and a change in the price level.
The price indexes, all inclusive, tell me whether I'm worse off or better off. Leaving out anything tells me less.
If you wanna forecast inflation, try the macro theory of your choice! Money, government spending, projected rainfall, animal spirits, length of skirts, whatever. Test your theory and don't confuse the issue.
I feel much better now.
I ran similar regressions recently as was similarly surprised.
ReplyDeleteI think folks should think more about this question: when inflation rises, where does it show up first? The answer is those products in which short-run income elasticities of demand are highest, and short-run supply elasticities are low. I can buy a new-to-me used car this weekend. But it takes (please check my arithmetic) 3 years to produce another 3-year-old used car. Therefore, some economists think that tracking used car prices is important to understanding inflation.
Another (perhaps more intuitive) regression specification would be:
ReplyDelete(Future CPI) = b1*(Core)+b2*(CPI-Core)+error.
It is just a linear transformation of row 2 or row 3 in your regression table, and a back-of-envelope calculation gave me b1=0.74 and b2=0.76.
So, core and non-core components appear to have similar impacts on future CPI, contrary to a common belief that the non-core component represents a transitory shock.
Commenting as an personal advisor trying to understand inflation impacts better on behavior. In the 'price/cost' of housing, I see clients experiencing high increases in utilities, property taxes, insurance, and services (i.e. mowing). Are any of these items considered in the cost of housing when looking at inflation?
ReplyDeleteI'm generally not a fan of regressions with the year-on-year numbers, but I got similar R^2s as you for how I would do it (my specifications were similar to your first two, but in terms of log changes of headline against 12 lags of lag changes in either headline or core).
ReplyDeleteA bigger issue is that the procedure that you describe for building up the headline inflation forecast from the core inflation forecast isn't actually how people do it in practice. The simple extension would be to add some variables to capture food and energy prices. A more sophisticated approach is to model some broad CPI categories, like core, food & beverage, and energy, and forecast them and then combine together to get the CPI forecast. A factor based approach could allow for a common component between the groups as well as sector-specific effects.
Another problem is that log levels of price indices are arguably I(2), rather than I(1). What this means is that if you difference the log levels of the price indices, then they could still be I(1) (i.e. the 1970s-1980s period doesn't look stationary to me). In which case, if a linear combination of these is I(0), you have a cointegration between them. I think this effect might be driving the result of people saying that core inflation predicts headline inflation.
Great point. But the real forecasting question is what the Fed will do conditional on the price trends. And the Fed remains deliberately ambiguous, redefining their preferred inflation measure and refusing to lay out their reaction function.
ReplyDeleteWORKING PAPER
ReplyDeleteImproving Inflation Forecasts Using Robust Measures
Randal J. VerbruggeSaeed Zaman
https://www.clevelandfed.org/publications/working-paper/2022/wp-2223-improving-inflation-forecasts-using-robust-measures
It's an incremental variance issue I suspect.
ReplyDeleteI recommend you look at the Dallas Fed's trimmed-mean measure of PCE inflation. The idea is great. Look for the signal and ignore the noise. We get rid of the noise by, each month, trimming the outliers on both sides of the distribution.
ReplyDeleteI think that is what the Fed was thinking when, in Arthur Burns days, it cooked up "core" inflation, on the theory that energy and food were always very noisy outliers. The outliers will change in one period compared to another. Just trim the outliers. Removing entire categories from the price index is a bias.
Does trimmed mean help to forecast inflation, in a way core does not, at least in my simple regressions? That's the key question. Inflation is inflation, and I don't get to pay trimmed mean prices at the grocery store. So the point of using it should be that it improves forecasts.
DeleteThis comment has been removed by the author.
Delete