The narrow question is whether the US spends "too much" on healthcare. A counterargument has always been, what else should we spend money on? As a society gets wealthier, it's natural to spend more on health care, just as we spend more on art, travel, and so forth.
(The counterargument to that is, whether we spend more or less is beside the point. The point is a dysfunctional regulated oligopoly is charging way too much for what we get. It's not so bad to spend this much, it's bad to get such a bad deal.)
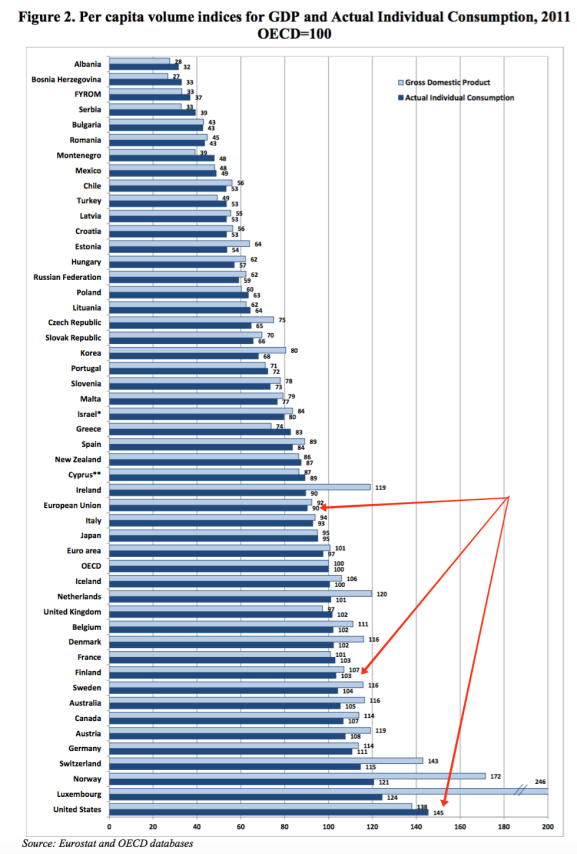
So, the question is not whether the US spends more on health care, the question is whether we spend more on health care relative to a measure of our standard of wealth. Using GDP as a rough proxy, we spend a lot more on health care relative to GDP than other countries.
But, the larger point of the blog post, on which I'll focus -- consumption is not GDP (income). Americans are far better off relative to other countries than we think we are. See the graph:
 |
| Source: Random Critical Analysis |
Much of the difference shouldn't last forever of course. How does the US consume more than we produce (GDP)? We borrow from abroad, and run trade deficits. Eventually that lending must be paid back. (Or at least those lending it to us hope so. We'll see.) Norway is the opposite. They produce a lot of oil, but use the results to save abroad in their sovereign wealth fund, which eventually they can draw on to finance consumption. (Or so they hope, also.)
In the meantime, though, the difference between income and consumption is quite large.
This difference is even more important in the cross-section. Income variation is often transitory -- you might have a bad year -- and consumption lasts longer. People in bad years draw down savings, borrow, or get help from relatives. Most of all, super-rich people save a lot. So inequality of consumption -- of actual standard of living -- is much smaller than inequality of one-year income or wealth.
RCA anticipates your first objection
this consumption measure includes government transfers, subsidies, etc, notably including the vast majority of healthcare and education spending, as Actual Individual Consumption (AIC) does.
Since some people earlier seemed to miss to this point, I’ll repeat: the only form of consumption excluded from AIC is that which cannot be attributed directly to individuals or households, i.e, collective expenditures by government like military procurement and the like.I.e. the one thing that is also much larger in the US. And RCA adds nice confirmation. The average US person lives in twice as much space as the average european. And
 |
but not at all relative to consumption. (Note the cool dynamic graph)
The post has lots more beautiful graphs on consumption and health care expenditures. But the main point -- consumption, not income (and especially not one year's income) is a much better measure of living standards -- is larger, and my point, so I'll stop here.
Oh, and I still think we're getting a massively raw deal from our inefficient health care system. As is much of europe.
John,
ReplyDelete"The actual standard of living -- consumption -- is higher in the US than in any of these other countries."
You might want to mention that the GDP shown in your graph is not nominal GDP but rather PPP (purchasing power parity) adjusted GDP.
http://www.economicshelp.org/blog/180/development/measuring-living-standards/
"GDP – Purchasing Power Parity PPP"
"Another important factor in measuring living standards is GDP measured at Purchasing power parity. This means that the statistics take into account the actual cost of living. For example, some countries may have lower GDP, but the cost of living is much cheaper. PPP adjusts for these different costs of living."
Also, it is not clear if "Actual Individual Consumption" is inflation adjusted.
What is the difference between the red and blue line in the dynamic graph?
ReplyDeleteThanks.
Anonymous,
DeleteThe red line is the trend line for one year of data for all countries included. The blue line is the trend line for all data going back to 1970.
Notice how the blue line remains unchanged even as the graph cycles through each year of data? Notice how the red line moves upward and to the right as the graph cycles forward every year?
@frank:
ReplyDeleteEssentially of the figures used (AIC, NHE, GDP, various other GDP components, etc) are per capita, constant prices, constant PPPs (with a base year=2010) as determined by OECD.
@anon: blue line is the trend across all years whereas red is the trend within a given year. Believe it or not in reasonably well specified models with year fixed effect the time trend is negligible (which tends to imply that technology and related time associated change is a proximate cause of rising health expenditures and not so much a root cause)
- RCA
Break up the hospital monopolies and increase the annual number of new doctors from 25,000 to 50,000, and call me in the morning.
ReplyDelete"How does the US consume more than we produce (GDP)? We borrow from abroad, and run trade deficits. Eventually that lending must be paid back. (Or at least those lending it to us hope so. We'll see.)"--Cochrane.
ReplyDeleteWell…I think the US also sells a lot of assets, particularly real estate, to pay for the imports. Is this controversial?
This selling of assets might be fine, except for property zoning. What we get is lots of demand for real estate (huge capital inflows), but a fixed supply (thanks to zoning).
The NY Fed put out a paper, later to appear the in the Journal of Journal of Money, Credit and Banking (author Ferrero), that found that nations running large current account deficits had house price explosions.
https://www.newyorkfed.org/medialibrary/media/research/staff_reports/sr541.pdf
This issue of huge capital flows and fixed property supplies is fascinating.
Some suggest "macroprudential" controls on property-lending, but I would prefer to see an end to property zoning.
It mystifies me that property zoning is never an issue. Perhaps it is so deeply embedded in our economy, and so embraced by the propertied and financial classes, that zoning deregulation is not a PC-topic.
"...the US also sells a lot of assets, particularly real estate, to pay for the imports."
DeleteThank you for pointing this out! It seems like for years I was the only one who was mentioning this, but lately I've been glad to see that others are as well.
Thank you also for mentioning something I hadn't thought of: that all those foreign purchases of real estate tends to raise price of (and/or reduce the availability of) such real estate for locals (U.S. citizen/residents).
Neal Reynolds
I too am curious why this is not a bigger issue on the left. Zoning hurts poor people and young people, especially urbanites who vote Democrat. Im pretty puzzled.
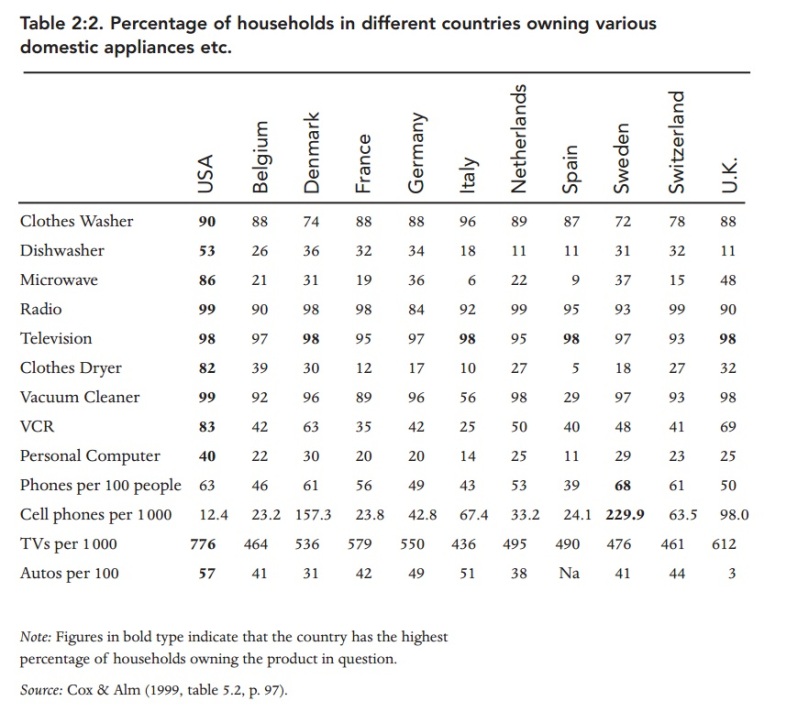
DeleteIn my world in which budget constraints actually exist,spending less than income is rather a positive sign. The fact that countries like Norway or Switzerland spend much less than income suggest to me that they are doing something right. People over there do not seem to struggle that much, or have lower standard of living. The high spending rate in the US compared to income is likely to indicate (as John wrote) that we pay way too much for 1) inefficient services, or 2) things that we do not need (really 776 TV for 1000 people...)
ReplyDelete"""(really 776 TV for 1000 people...)"""
Deleteand that was 1999 ...
"Eventually that lending must be paid back."
ReplyDeleteJust a quibble, but in the aggregate, it doesn't. Of course each individual loan may get paid back as it matures, which is what matters for each lender. But in the aggregate, as long as our current account deficit is less than the growth rate of NGDP, then we will not be "paying back" in the aggregate. For example, if our NGDP grows at 4% per year and we consistently run a current account deficit of 3%, then the cumulative deficits will stabilize at 78% of our NGDP.
Bill,
DeleteFirst, presuming that we are borrowing from abroad to fund that deficit the interest expense must be taken into consideration.
NGDP growth = 4% per year
Debt growth = 3% per year (from the deficit) + 2-3% (from the interest on accumulated debt)
I think it's pretty easy to see how this could spiral out of control - assuming that the debt makes regular interest payments.
Second, you are assuming that in the case of federal debt, government receipts will keep pace with NGDP.
https://fred.stlouisfed.org/series/FGRECPT
https://fred.stlouisfed.org/series/GDP
The high water mark was in 2000 - receipts as % of nominal GDP stood at 20%. The low water mark was in 1950 - receipts as % of nominal GDP stood at about 13%.
Frank, Thanks for the comments. Note - interest payments are included in the current account deficit. So they are in the 3% deficit. You are right that if our interest payments amounted to 4% of NGDP then the rest of our current account would have to be a 1% surplus. Yes, things could also spiral out of control, but I was simply addressing the "eventually that lending must be paid back" statement which I don't believe is correct. Re the federal debt, a country can run a current account deficit even if it has issued no gov't debt. Keep in mind as well that our capital account surplus involves Both US buying of foreign capital and foreign buying of US capital. To date, US investors have earned higher returns on its capital than foreign investors have earned here. So that's financed even greater purchases of foreign goods by US buyers.
Delete"We borrow from abroad, and run trade deficits. Eventually that lending must be paid back." I was surprised (as, I think, were Benjamin Cole and Bill, above) to see something so misleading--though admittedly not outright false--written by a good economist. We do borrow from abroad, and those loans (like all loans) must be paid back, but at the same time we will almost certainly be able to take out fresh loans. Thus we may well be able increase our level of indebtedness indefinitely, as our economy and that of the world continue to grow. And running a trade deficit is only loosely related to foreign borrowing; insofar as the trade deficit reflects foreign *equity investment* in America (as opposed to foreign *lending*) there is nothing to be *paid back*.
ReplyDeleteTo be clear, AIC is not actually greater than GDP in absolute terms. That figure is volume of AIC and GDP (effectively real values using the PPPs for both columns) indexed to OECD mean. What it says is that US real AIC is proportionally greater than the OECD mean by a larger proportion than US GDP is greater than the OECD GDP mean. US is unusual in that it combines high GDP with a high consumption share of GDP (most high GDP counties in OECD have low consumption shares... it's quite inversely related correlated)
ReplyDeleteIs health care consumption included in actual individual consumption? In that case, if consumption = healthcare consumption + noise, then it is not so crazy that all the
ReplyDeleteCountries are lined.
The same thought occurred to me at first. But, then I saw this:
Delete"Even if we remove HCE from AIC, to preemptively address complaints that the vast majority of HCE is allocated to AIC (and thus mechanically contributing to this relationship), we find much the same result!" The log-log regression with HCE subtracted from AIC gives a slope of 1.482 which is significant at the 1% level, and it gives an adjusted R^2 of 0.90. Clearly there is a strong linear relationship.
Yes, anon, AIC very much includes (current) health expenditures, education, and more.... even when it's in-kind or paid for directly by government and non-profit institutions.
DeleteSimilar correlations are obtained even when NHE is subtracted from AIC, this despite the fact that NHE consumes an increasing share of AIC as countries get richer in the long run everywhere, so this means less than you might think. Also much the same argument can be made for NHE/GDP (and disposable income etc etc)
Much of the GDP of Switzerland is produced by commuters from France and other countries, so it is not consumed by the Swiss. The same goes for Luxembourg. Much of the GDP of Ireland is consumed by foreign investors and not by the Irish.
ReplyDeleteIt is very interesting! Thank you!
ReplyDeleteYou may be interested in my latest blog post wherein I analyze this data as as it relates to gross adjusted household disposable income (including net effects of in-kind transfers).
ReplyDeletehttps://randomcriticalanalysis.wordpress.com/2017/04/13/disposable-income-also-explains-us-health-expenditures-quite-well/
After witnessing budget cuts where I am from, spending less than income is a positive sign that indicates the value of money. The fact that some countries like Switzerland and Norway spend much less than income sieges that their economy is on track and doing the right thing. Residents of those countries do not seem to struggle in terms of money as much, nor do they have low standards of living. The spending rate in the US is compared to other countries and indicates that we pay too much for inefficient services or things that aren't necessities.
ReplyDeleteHi all,
ReplyDeleteI find it interesting that the U.S. spends much more on healthcare relative to our GDP compared to other countries. However, this could be related to the inefficiency of our healthcare system as you mentioned. Insurance companies and pharmaceutical companies seem to charge absurd rates for medicine and healthcare which is most likely why it appears the U.S. spends a lot on healthcare. My mom has some medical issues and the prices she would have to pay without insurance seem ridiculous. I like the graph comparing GDP to consumption to determine standard of living because it seems much more in line with other countries. Simply spending more money on healthcare does not necessarily mean better healthcare and lots of money seems to just go to businessmen and executives instead. The U.S. should really be moving to universal healthcare anyway considering how many people suffer just because they have no insurance.
Thanks:)
ReplyDelete