Long term investors care about money when they retire, not next month. Most investors are long-term.
If inflation is steady, long-term bonds are a safer way to save money for the long run. If you roll over short-term bonds, then you do better when interest rates rise, and do worse when interest rates fall, adding risk to your eventual wealth. The long-term bond has more mark-to-market gains and losses, but you don't care about that. You care about the long term payout, which is less risky. (Throw out the statements and stop worrying.) So, in an environment with varying real rates and steady inflation, we expect long rates to be less than short rates, because short rates have to compensate investors for extra risk.
If, by contrast, inflation is volatile and real rates are steady, then long-term bonds are riskier. When inflation goes up, the short term rate will go up too, and preserve the real value of the investment, and vice versa. The long-term bond just suffers the cumulative inflation uncertainty. In that environment we expect a rising yield curve, to compensate long bond holders for the risk of inflation.
So, another possible reason for the emergence of a downward sloping yield curve is that the 1970s and early 1980s were a period of large inflation volatility. Now we are in a period of much less inflation volatility, so most interest rate variation is variation in real rates. Markets are figuring that out.
Most of the late 19th century had an inverted yield curve. UK perpetuities were the "safe asset," and short term lending was risky. It also lived under the gold standard which gave very long-run price stability.
(Yes, this argument is about portfolio variance, not beta, and assumes that the bond portfolio is a substantial part of the investor's wealth, or that inflation happens in bad times, at least over the investor's long horizon.)
***
This is a follow-up to low bond yields. That post has several good comments with links to the literature.
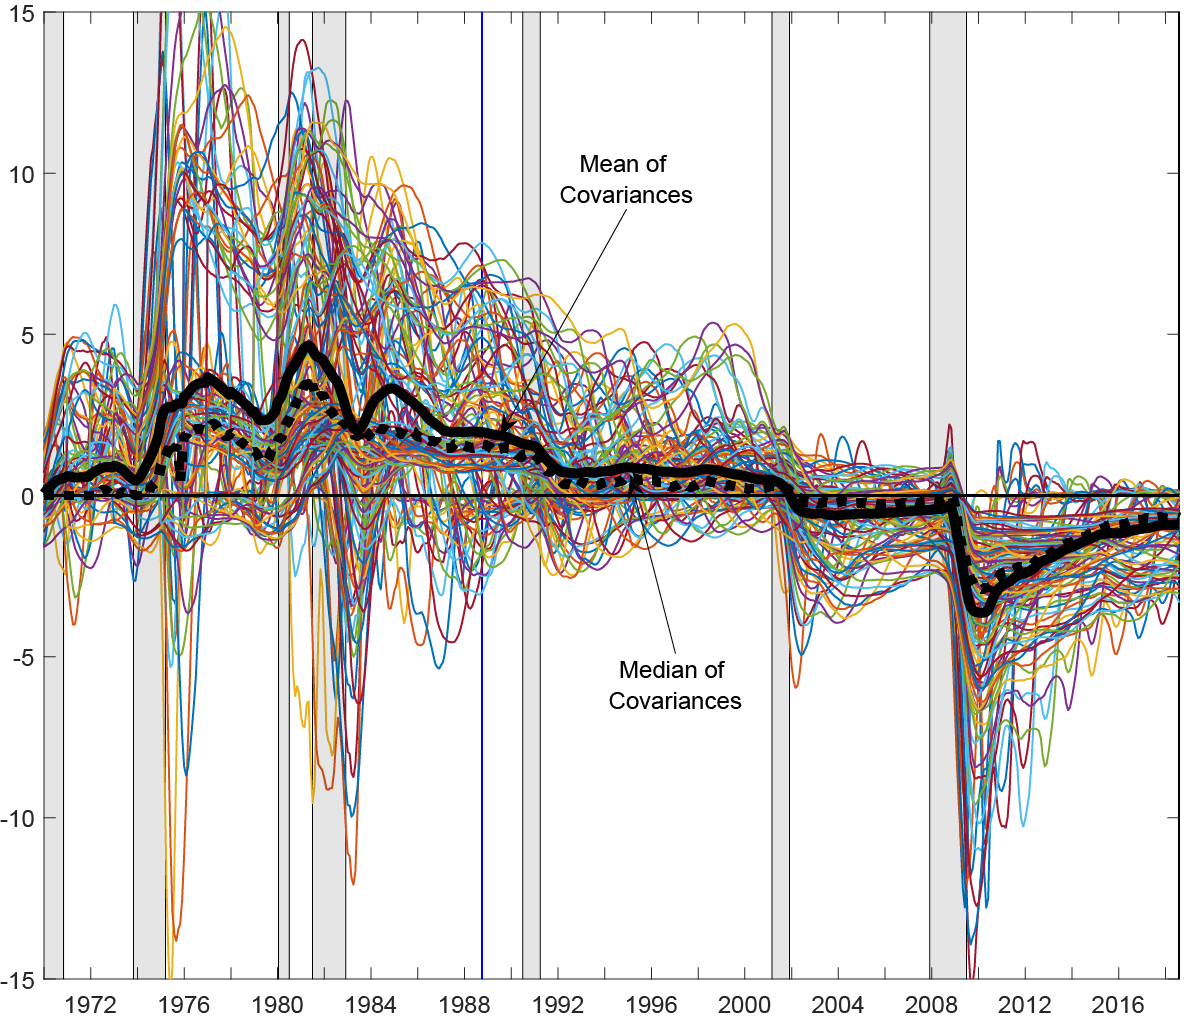
On that point, Uri Carl and Anthony Dierks send along this lovely graph from their note which makes the same point as my earlier blog post. The plot is different measures of the time-varying "covariance between Real Activity and Nominal Measures." The covariance changes sign, as I suspected.
Are we to believe that inflation will stay steady for 30 years? Now, that's risky!
ReplyDeleteIs it more likely that technology and innovation will continue to exert an outsized amount of deflationary pressure (preventing a rise in inflation)? I'd say yes.
DeleteThe markets believe inflation will stay low for a long period. QE has probably distorted the curves. Global growth declining. Perhaps inflation will stay in check for 5 years which in these turbulent times is long.
ReplyDelete"Most of the late 19th century had an inverted yield curve. UK perpetuities were the "safe asset," and short term lending was risky. It also lived under the gold standard which gave very long-run price stability."
ReplyDeleteDid not deflation/negative inflation coincide with periods of growth during the 19th century too?
Since there was basically no growth, or at least no technology based growth, until 1870 the answer is no.
DeleteDoes liquidity preference not factor in anywhere? It's the first thing that should come to anyone's mind to explain why yield curves typically aren't inverted.
ReplyDeleteFollowing this argument, we suppose to see more inverted curves after the 1980s and less inverted curves during 1970s and 1980s. However, the data tell us the opposite.
ReplyDeleteSee a nice graph (Figure A1 on page 40) in my paper:
http://blogs.bu.edu/maxzhao/files/2019/08/Learning_Equilibrium_Trend_and_Cycle_in_Yields_201908.pdf
Price controls on many things such as dairy have kept inflation at our dinner tables very low, but if you try to purchase a new truck you will pay approximately 10x what they cost just 30 years ago. Apply that same inflation rate to precious metals & it is easy to see why anyone with any cash should leverage it with at least some silver while you can afford it. I put a $20 bill & a Silver Eagle into m child’s hand & asked him which 1 would he trust to be more valuable to his child?
ReplyDelete"Long term investors care about money when they retire, not next month. Most investors are long-term."
ReplyDeletePrices are set by the most recent transaction, most transactions are made by short term traders.
In the nineteenth century long periods of deflation lead to worker impoverishment which then triggered wars or revolutions. How do we avoid repeating that?
ReplyDeleteAs someone posted on Marginal Revolution: this argument seems to imply that the TIPs yield curve should always be inverted. It is not. How should we think about this?
ReplyDeleteWould steady inflation also reduce the value stock risk premium by enabling firms to float along in the face of debt service payments?
ReplyDeleteDo I risk NO inflation for ten years? Nope! Given government debt of 17 trillion and deficits of nearly one trillion, inflation could ramp up in five years. If people are convinced the government will resort to the press or Krugman’s helicopter to finance increasing deficits, they’ll anticipate future inflation and dump today’s currency post haste. The effect, prices will be driven up pretty much everywhere. At the current rate of spending, debt to GDP will be about 1.2 to 1 in ten years. Debt service and rolling debt will demand more taxes, cuts in SS and Medicare and finally printing dollars. I will not lend for ten years at 1.12%, after taxes, as I already anticipate inflation.
ReplyDeleteWhy doesn't Treasury sell ten year debt instead of one year debt, gain a quarter point? Answer that first, that is half the answer.
ReplyDeleteSurely credit risk is a factor not considered here? Short-term creditworthiness is more trustworthy than long-term creditworthiness, which is a risk premium not considered here. This is a large reason why ceteris paribus long term rates are higher than short term rates
ReplyDeleteThe two problems I see are the following:
ReplyDelete1. What about the time value of money? Shouldn't there be a greater premium built into longer rates? How much would reduced reinvestment risk offset the premia?
2. Why should we want stable inflation? Keeping aggregate demand on trend would require something like NGDP level targeting, which allows for more variable inflation. Inflation targeting and other stable inflation approaches are suboptimal.
A year ago, the U.S. Treasury note yield curve was 'normal', i.e., yields increased monotonically with maturity date. Today, Sept. 13th, the U.S. Treasury yield curve is shaped like a slung hammock tied at its end points--the Fed-Funds Rate at the short end of the maturity range and at the 30-bond yield to maturity rate at the long end. This is not an inverted yield curve. The long end yield exceeds the yield rates of all shorter maturity Treasury Bill's and notes.
ReplyDeleteOn the question raised in the blog pertaining to the appropriate rate of interest for long maturity Treasury notes and bonds, the contrast between the Treasury yield curve rates one year ago and the corresponding yield curve rates today does comport with your assumed long bond interest rate model. There was no less nor no more uncertainty a year ago about inflation than there is today. What is different today from a year ago are: a) the ECB has increased the negative interest rate to -0.50%/annum and shows no inclination to reverse course anytime soon, and b) equity markets are showing signs of stalling and rolling over in anticipation of a decided political risk to economic growth potential arising from a change in administrations in 2021. The two combine to make U.S. Treasury securities attractive. The effect is pronounced in the middle maturities, in keeping with the currently fashionable view that 10 years represents the long end of the yield curve. To a European, 1% per annum is preferable to negative 0.5% per annum if one can obtain a currency forward that immunizes the forex risk at small relative cost.
The U.S. short end of the yield curve rates is dominated by the Fed's IOER policy on overnight deposits. The FOMC is evidently undecided on its policy course going forward--reduce the overnight rate, or hold it steady? The trajectory of inflation is also unknown to the FOMC. Is it upward bound, or steady? In light of the trade frictions generated by the U.S. Administration, one would expect rising price levels domestically with increasing import tariff rates and restricted import quantities. Price level changes are notoriously slow to emerge before inflation becomes apparent in the govt statistics. But once embedded, it is difficult to reverse, as one who experienced it in the 1970s and 80s can attest.
If the FOMC continues to err on the cautious side, and the ECB sticks to its view of slow growth and low inflation expectations in Europe, we can expect to see the current slung hammock shaped yield curve to persist. At least until the path of inflation becomes evident.
Data source: https://www.wsj.com/market-data/bonds
Hamilton's discussion of failure of corridor to set fed funds rate, says discount rate is not a ceiling and IOER not a floor.
ReplyDeleteHe says the repo rate on general overnight transaction (GTC) acts as a floor, The finance press is now piling on for the Fed to make more purchases and have a standing repo facility. John, what's going on this week with freaky high repo rates? Thanks
Interestingly, I was (re) reading Adrien Verdelhan's FX Habits paper when I realized you and Monika Piazzesi made the same point in "Decomposing the Yield Curve", but with much more detail.
ReplyDeletehttp://web.mit.edu/adrienv/www/FX_Habits.pdf
"More generally, Cochrane and Piazzesi (2008) note that the real yield curve should be downward sloping when inflation is stable. In that case, interest
rate variations come from changes in real rates. Long-term bonds are safer investments for long-term investors because rolling over short term bonds encounters the risk of short-term interest rate changes."
https://faculty.chicagobooth.edu/john.cochrane/research/papers/interest_rate_revised.pdf
Stable inflation in the past doesn't lead to inverted yield curves. Stable inflation projections into the future do so. I have trouble visualizing a situation where we can confidently project future stable inflation. Because of the enormous deficit and national debt along with grandiose spending plans and tax cut plans, we cannot be confident of future stable inflation, no matter how many past years of it we have seen.
ReplyDelete