
Source here.
Inflation seems to be waning. The conventional change from a year ago:


The standard fiscal theory 101 says that a $5 trillion fiscal blowout will lead to an increase in the price level, to inflate away outstanding debt. But that inflation eventually goes away, even if the Fed does nothing. It goes away a little faster if the Fed raises rates. The central graph: here's what happens in response to a big fiscal shock, if the Fed does nothing. Inflation rises but fades away as the new debt is inflated away. (π is inflation, x is output gap (output-steady state or potential), p is price level, i is interest rate. This is an impulse response function, how the variables change in response to the shock, hence based at zero.)

So, while inflation was still increasing, starting here, last March, here at length for the Hoover monetary policy conference published as "inflation past present and future," more distilled here with the first draft of "fiscal histories," here with the clarity of continuous time models, here in the WSJ and here with pictures, here in the first draft of "expectations and the neutrality of interest rates," I did go out on a limb with the view that inflation would abate, even without the Fed dramatically raising interest rates. Then, updated here as inflation did after all start to ease. (Hmm, I seem to be making the same point a few too many times!)
I call this the "second great experiment," as conventional theory says the Fed needs to dramatically raise interest rates above current inflation to bring inflation down.
Now, to Luther's point. Is this not a victory lap for "team transitory," the view that inflation is just "supply shocks" that go away on their own?
No. A "supply shock" would raise prices temporarily, and then prices would fall back down to normal once the supply shock is over. A supply shock all on its own cannot permanently raise the price level. How is the price level doing?

The cumulative inflation has shifted up the price level by something like 10-20%, depending what you think about the earlier trend. The pure "supply shock" view says that we should now experience a symmetric period of deflation to bring the price level back to where it was, or at least to that plus a 2% trend. The fiscal theory or "demand" view says that this price level shock is permanent, or at least until something else comes along; a fiscal retrenchment would be necessary to lower the price level back to where it was.
Well, it hasn't happened yet. The current end of inflation does not prove the "supply shock" view right. Perhaps it will. If we get a period of 10% deflation, just as unrelated to Fed action as the inflation was, then the supply shock view can take a turn of "we told you so." Though, of course, nothing in economics is ever so simple.
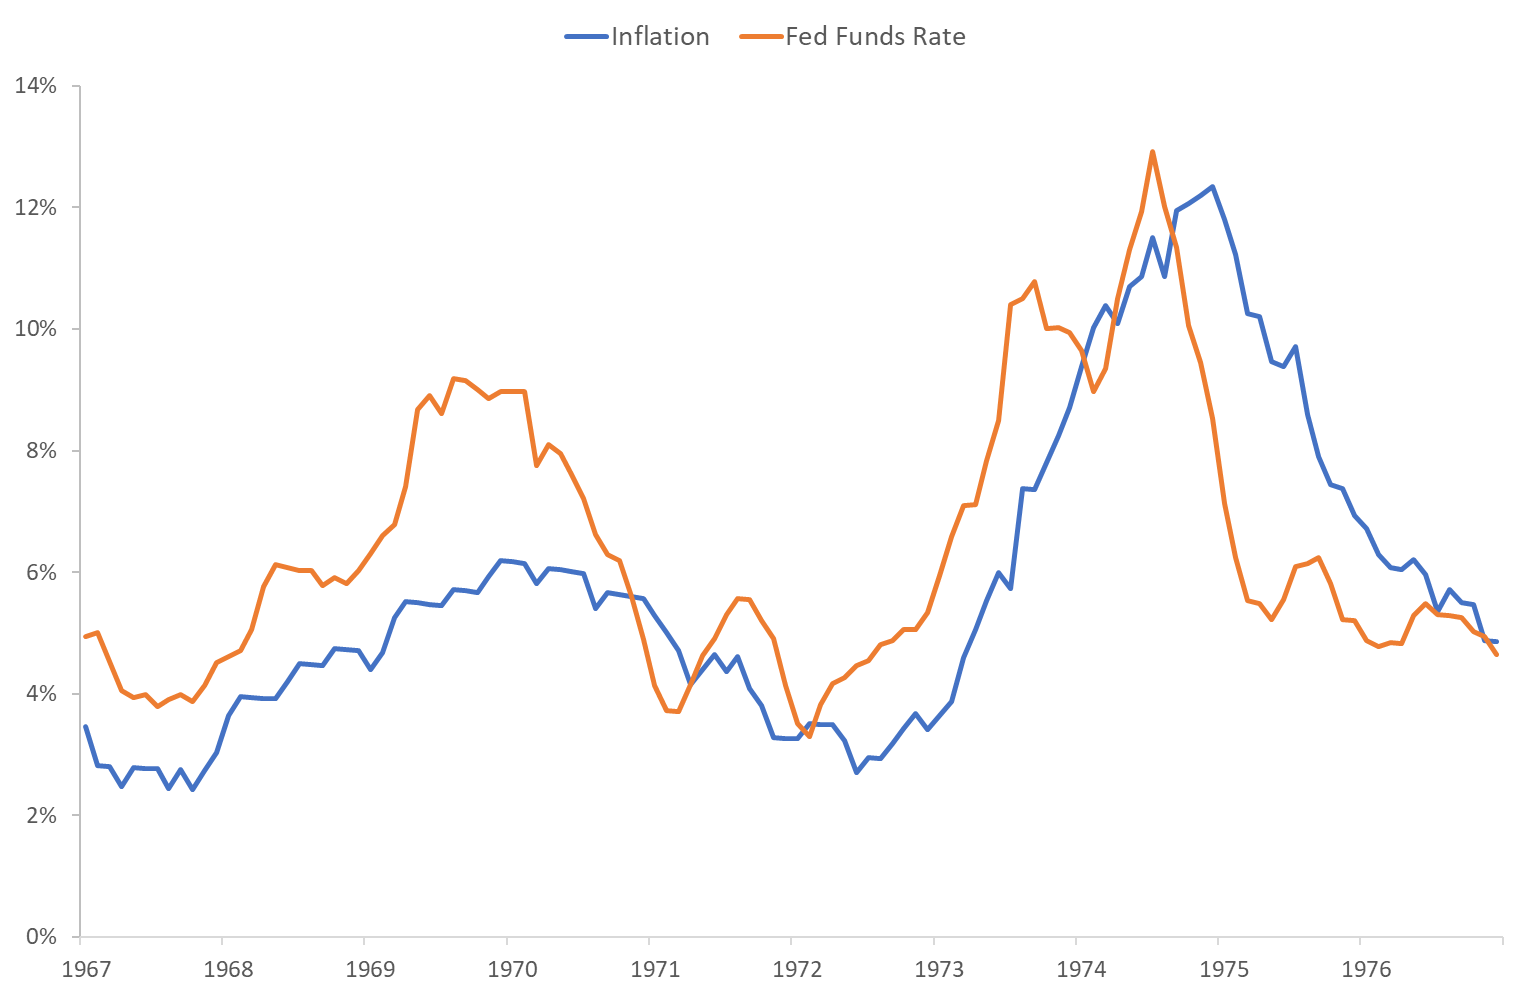
What happens next? In the simple fiscal theory model, the Fed can lower inflation today, but only by making future inflation a bit worse. That is desirable too. For the recent Hoover economic policy roundtable, I made the following graph:


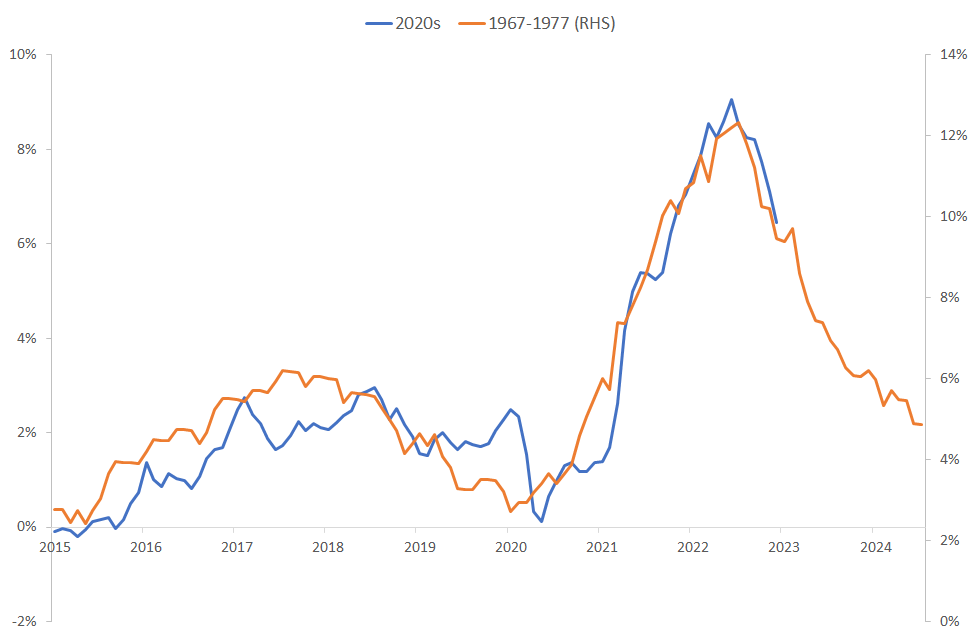
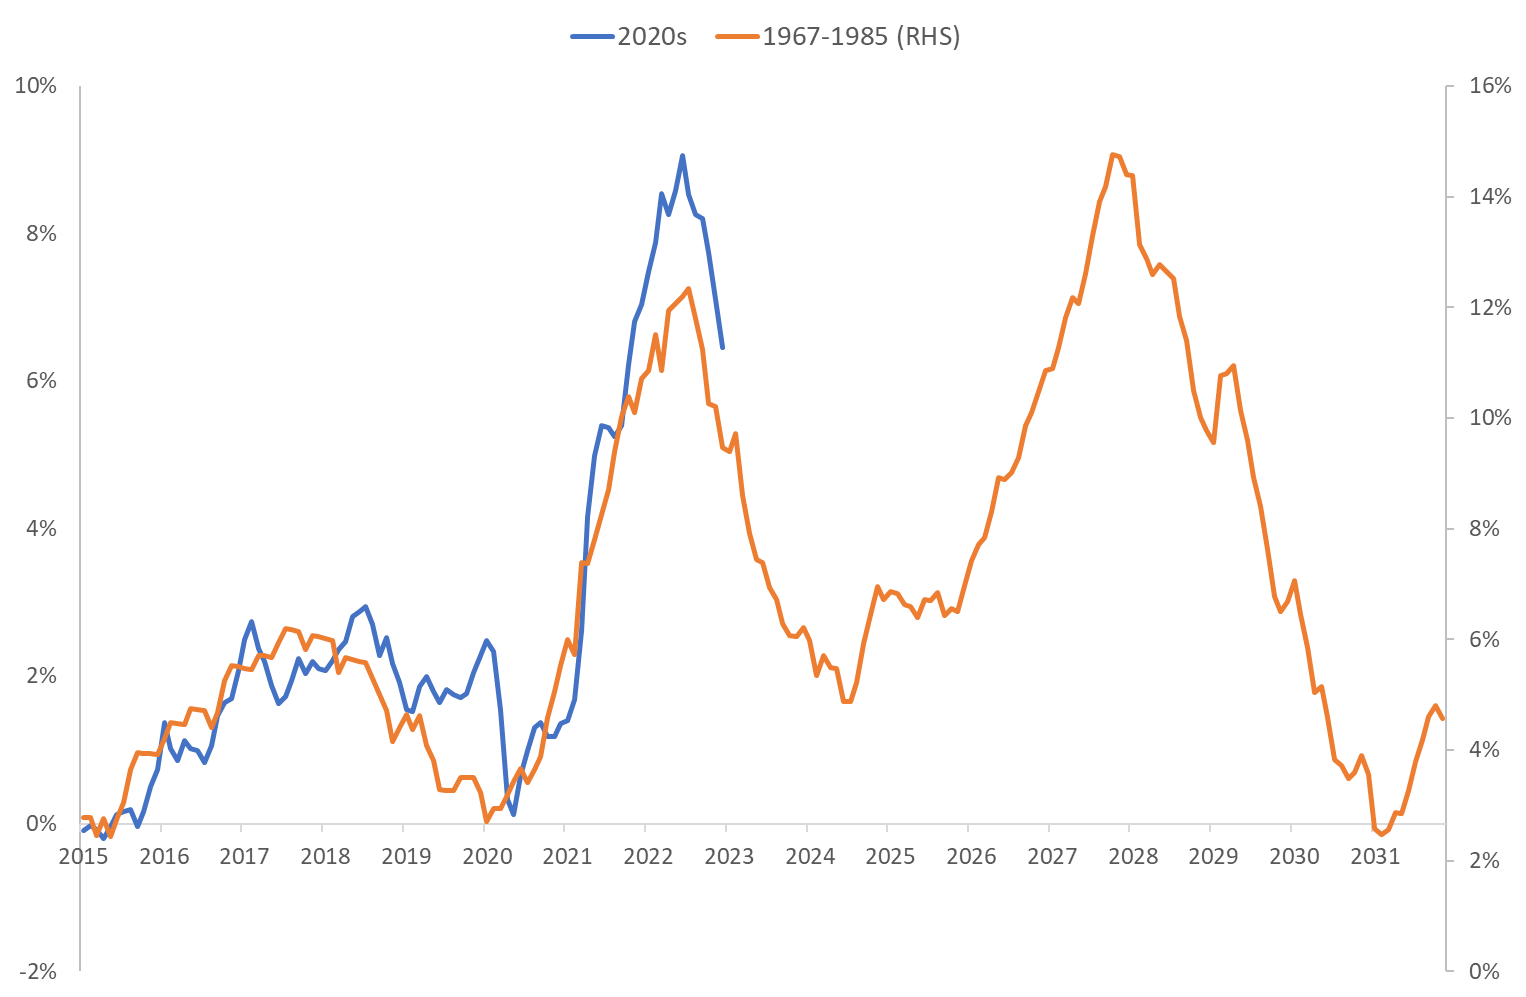
Update: Jesper Rangvid overlays inflation in the late 1960s through 1975 to inflation today,
Now:
 |
I think the label of 'supply' shock above refers to 'cost-push' shock which may result in transitory price level changes. On the other hand business cycles driven by long-run TFP shocks may also result in permanent changes in price level and in that case the label 'supply' to such shocks might not be accurate.
ReplyDeleteInflation seems to be abating and if more the question may seem to be what will policy be for the Fed to get it down to the desired 2% rate? As in weight loss where one loses a substantial amount of weight, those last stubborn ten pounds are a challenge. Interesting times for macro..
ReplyDeleteI understand that at one time supply shock does not lead to a permanently higher rate of inflation. But what we have in the US is a series or continuing string of supply shocks, in terms of housing, along the West Coast and in some other markets.
ReplyDeleteObviously, housing is a huge component of the CPI. Moreover if workers cannot afford housing, then ultimately wages go up.
So housing price shocks feed into wage shocks in a continuing pattern along the West Coast and other markets.
If property zoning was eliminated along the West Coast, I suspect we would see lower housing costs feed into the CPI as measured, and some easing of wage pressures.
And more importantly, we would see higher living standards.
What's the difference between a "permanent supply shock" and "we overestimated potential GDP?"
DeleteThe latter means you've likely created too much money.
Almost all of the "reduction" in headline cpi is attributable to a 30% decline in oil prices. Core inflation is still circa 3x the target rate. Unit labor costs are still out of control and inflationary expectations, outside of unreliable market surveys and implied inflation rates, are nowhere near the target rate. Also, real rates are still negative. This is nowhere close to being over
ReplyDeleteSpeaking with Aristotle, one cannot explain a phenomenon with its components. A change in prices is the definition of inflation, not its explanation.
DeleteI believe core came in at 3.7%
DeleteNot 3x target but still unacceptably high
disagree....with crushing debt, interest rates will eventually increase raising inflation. It may take time...but you are debasing the currency. Going to be fun watch Japan, show us the way. They are trying everything to stop the obvious.
ReplyDeleteI’m surprised you would recommend a post on the inflation of the 70s that mentions early-70’s “oil shocks” without mentioning the flotation of the Dollar. The quadrupling of the gold price preceded the quadrupling of the oil price, which OPEC minutes from the time confirm was in response to the devaluation of the Dollar. In other words, there was no supply shock on oil. It was a demand shock (perhaps exacerbated by bad domestic energy policy).
ReplyDeletePolicymakers in the 70’s were fumbling with the fallout from the break in fixity, amidst overly-loose fiscal policy. It was akin to a present-day EM currency crisis (of confidence).
The current fiscal error was one-off, in response to a 100-year emergency.
Drawing comparisons based on spaghetti analysis of the two CPI trajectories hardly seems advisable,
This is a very good comment. Of course the post is not a comprehensive comparison of the 70s and today. Indeed, the breakdown of Bretton Woods, and the lingering effect of a gold standard which is a price level commitment has a lot to do with inflation emerging in the early 70s. 100 things were different. Still, it is useful to look back and remember previous times when it looked like inflation was going away without much action by the Fed, and remember both that it could happen, and that it could eventually be followed by renewed trouble.
DeleteEverything good, Dr. Cochrane! Supply "shocks" can be temporary or permanent. Say, California ports close forever. [:-)] Effect on the price level is correspondingly temporary or permanent. Looks like inflation, but it's just a movement to a new price level.
ReplyDeleteCheers!
The last chart in the article appears to settle once and for all the question of whether or not the rate of interest drives the rate of inflation or follows it.
ReplyDeleteThe rate of inflation is depicted as the 12-month proportional change in the price index ('price level'). When the curve faired through successive readings of the price index is convex to the abscissa, the 12-month proportional change is a fair proxy for the rate of inflation. But when there is a break in the rate of change in successive readings of the price index, then the 12-month proportionate rate of change does not represent well the rate of inflation. We see this reflected in the price index readings of the past six months. It is simply an artifact of the construction of the headline inflation rate.
ReplyDeleteThe month-to-month proportionate change in the price index shows this effect, accompanied by 'noise' in the signal.
However, the effect is more clearly evident when the time series of the price index is censored on the left, say at June 2021, and the time series is rescaled to set the price index at 100 as at June 2022. The resulting chart clearly shows the break in slope of the time series, that the year-over-year measure of the proportionate change in the price level obscures.
2020-2022 clearly represented the abolition of the 1951 Treasury-Federal Reserve Accord.
ReplyDelete"represented", or "portends"?
DeleteThe distributed lag effects of monetary flows, the volume and velocity of money, have been mathematical constants for > 100 years. Inflation will fall when the distributed lag effect, its rate-of-change, drops.
ReplyDeleteTry using geometry. Inflation is a construct. Example: Let the price level versus calendar time describe a monotonic concave curve of non-negative reals; place a straight-edge anywhere between two points lying on the curve and draw a line joining the points of intersection of the curve and the straight-edge. Now, advance the straight-edge to the right so that it intersects the curve where the right-most intersection of the drawn line and the curve is located and measure off an equal distance on the abscissa to the distance between the first and second intersection points found when drawing the first straight line and lay the straight-edge in the new position so that it crosses the curve where the vertical gridline just found intersects the curve. The slope of the straight-edge will be lower than the straight line first drawn. But the slopes of tangents at the intersections of the curve and the straight line and the straight-edge are lower still the further one moves the straight-edge while maintaining the distance between successive intersection points constant. The "lag" that you observe in the year-over-year calculation of "inflation" is an artifact of the method of measurement of the 'rate of inflation'. It leads you to draw incorrect conclusions.
DeleteYou can see this clearly using the FRB-St. Louis's FRED graphing utility. Plot the natural logarithm of the time series {CPIUASCL} from 1/1/2010 through 12/31/2022 on an Excel spreadsheet graph, breaking the series into three groupings (1/1/2010 - 12/31/2019; 1/1/2020 - 6/1/2022; and, 6/1/2022 - 12/31/2022). For the first and third groupings, use the Excel "add trendline" function (specifying a linear curve fit). For the second grouping, use the Excel "add trendline" function (specifying a 2nd-order polynomial curve fit). Without going to the trouble of running a regression calculation, you can will see that for the first and third groupings, the inverse of the time constants of the exponential curve (the slopes of the linear curves fitting the data groupings) are approximately 2.4% +/-. The second grouping's curve fit is not relevant to this discussion, but it is clear that the price level process has changed from 1/6/2022.
We don't see that reflected in the headline "rate of inflation" bandied about in the financial press. Some would say that it is too early to certain that the price level process has indeed changed. And that is a useful caution. But, the talking points coming from the FOMC voting members in recent months suggests, strongly, that the FOMC is seeing this in the data that they are reviewing prior to and during their rate-setting meetings of late. That's why J. Powell is constant in warning that it is too early to "let down our guard."
An interesting question then arises: Does the price level data generation process have a unit root (or, multiplicity of unit roots)? If it does, then the price level will never resume the trend followed prior to the ‘monetary shock’. However, if it is does not have a unit root, or a multiplicity of unit roots, then it will revert to the trend followed prior to the ‘shock’ (provided the price level process is not ‘explosive’). Then in monetary terms, I suppose, one could say that the ‘shock’ was transitory and the price level generating process is ‘mean-reverting’ around a non-negative trend. Speculative? Of course. But, theory and hypotheses are initially built upon speculations.
How does this fit into the comparison? https://pages.stern.nyu.edu/~pschnabl/research/DSS_inflation.pdf
ReplyDeleteIf this publication is that which you are referring to, "The Financial Origins of the Rise and Fall of American Inflation," April 2021, then it may indeed have a bearing on the question of what factors drive inflation. It received the Marshall Blume Prize in Financial Research (First Prize), University of Pennsylvania, 2020. Authors: Itamar Drechsler, Alexi Savov and Philipp Schnabl.
DeleteSuch an interesting thought brought up today by CNBC anchor, Brian Sullivan. Does the CPI or any other inflation metric capture the very large increase in interest payments by individuals on their consumer debt. With consumer non-mortgage debt at such high levels it would seem quite relevant.
ReplyDeleteI feel stupid for asking, but what does x, p, i, and pi in the graphs represent? Thank you,
ReplyDeleteIgnore my previous question. After a little digging through the excellent links you had, I found my answers. Mostly. Is "x" unemployment percentage? Thank you.
ReplyDeleteSee David Romer's textbook, Advanced Macroeconomics, 5th Edition, for explanations of the terminology and the development of models.
DeleteDr. Corchrane said "Well, it hasn't happened yet. The current end of inflation does not prove the "supply shock" view right. Perhaps it will. If we get a period of 10% deflation, just as unrelated to Fed action as the inflation was, then the supply shock view can take a turn of "we told you so." Though, of course, nothing in economics is ever so simple."
ReplyDeleteCan we really imagine 10% deflation? Would not that imply a big drop in GDP that the Fed would try to avoid with looser monetary policy? And if the answer to my latter question is yes, doesn't that imply that no matter if the cause of inflation was a temporary supply shock or a positive fiscal shock, we will not see level of prices decrease?