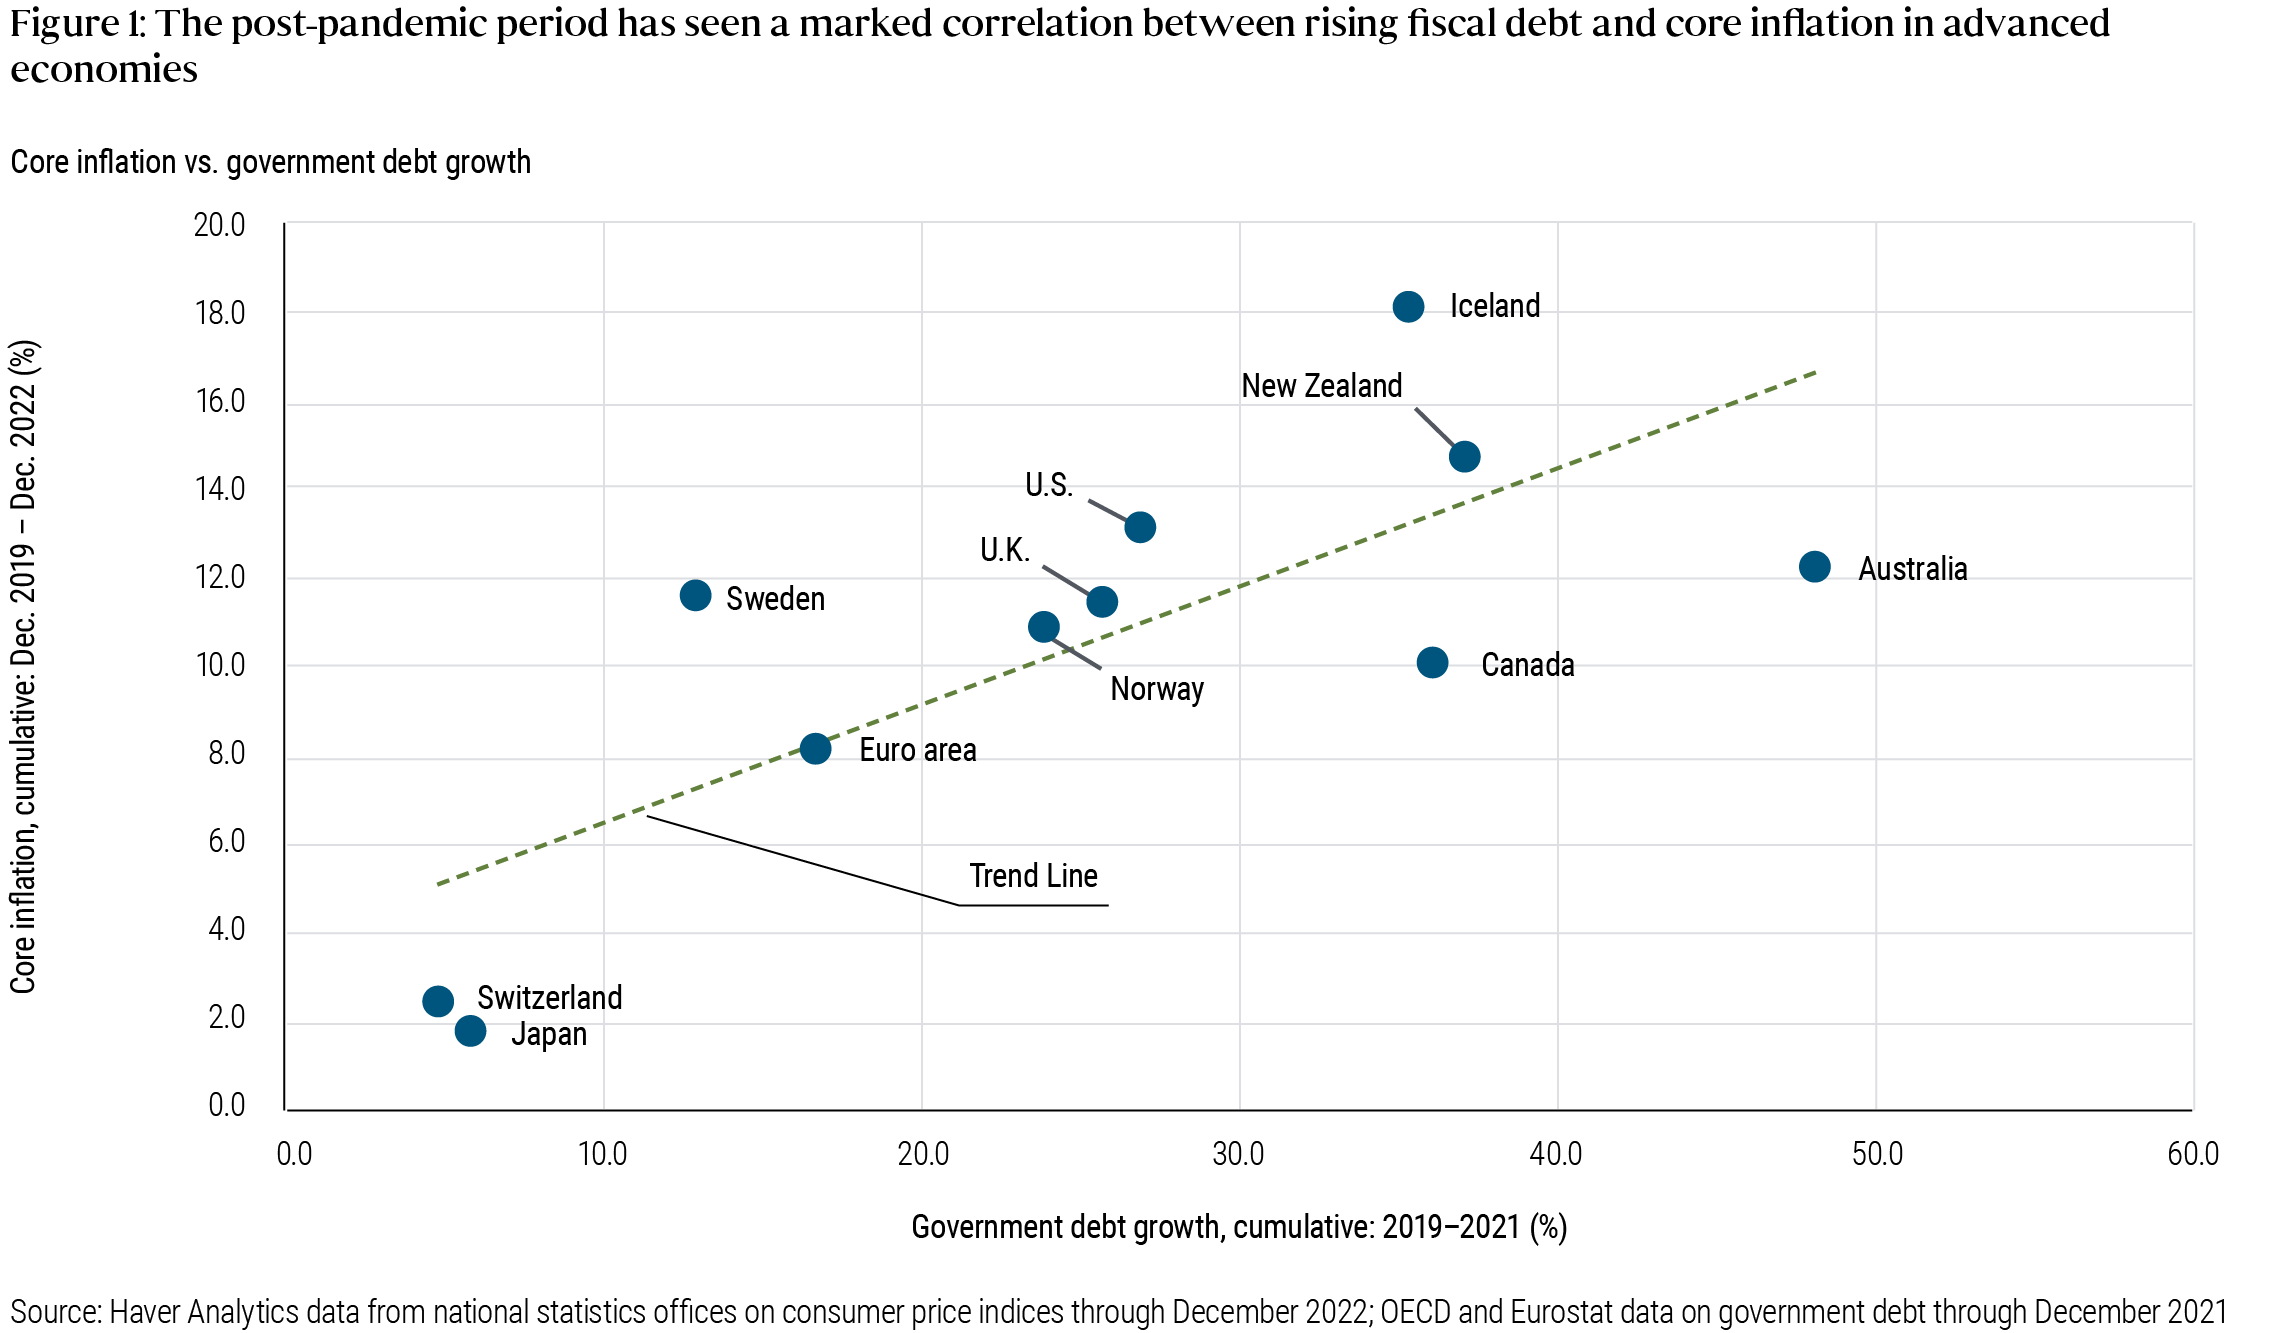
Peder Beck-Friis and Richard Clarida at Pimco have a nice blog post on the recent inflation, including the above graph. I have wondered, and been asked, if the differences across countries in inflation lines up with the size of the covid fiscal expansion. Apparently yes.
It's a simple fact, and it's dangerous to crow too loudly when things go your way. Fiscal theory says that inflation comes when debt or deficits exceed expectations of a country's ability or will to repay. The latter can differ a lot. So, it does not predict a simple relationship between debt or deficits and inflation. Still, it's nice when things come out that way, and more fun to write qualifications than to come up with excuses for a contrary result!
I have seen other evidence that doesn't look so nice (will post when it's public). One example is across eurozone countries. But that's a good reminder where to expect success and where not to expect success. Inflation as described by most macro models, including fiscal theory, monetarism, etc., is the component common to all prices and wages. It is in essence the fall in the value of currency. In any historical experience we see lots of relative price changes on top of that, in particular prices over wages. Indeed inflation is only measured with prices, and a central idea is to measure the "cost of living," not the value of the currency. Across the eurozone there is only one currency and thus only one underlying inflation. The large variation in measured inflations are relative prices, real exchange rates between countries, and can't go on forever. That we cannot hope to explain inflation variation across countries in the eurozone with a simple theory that describes the value of currency gives you some sense of the error bars in this exercise as well.
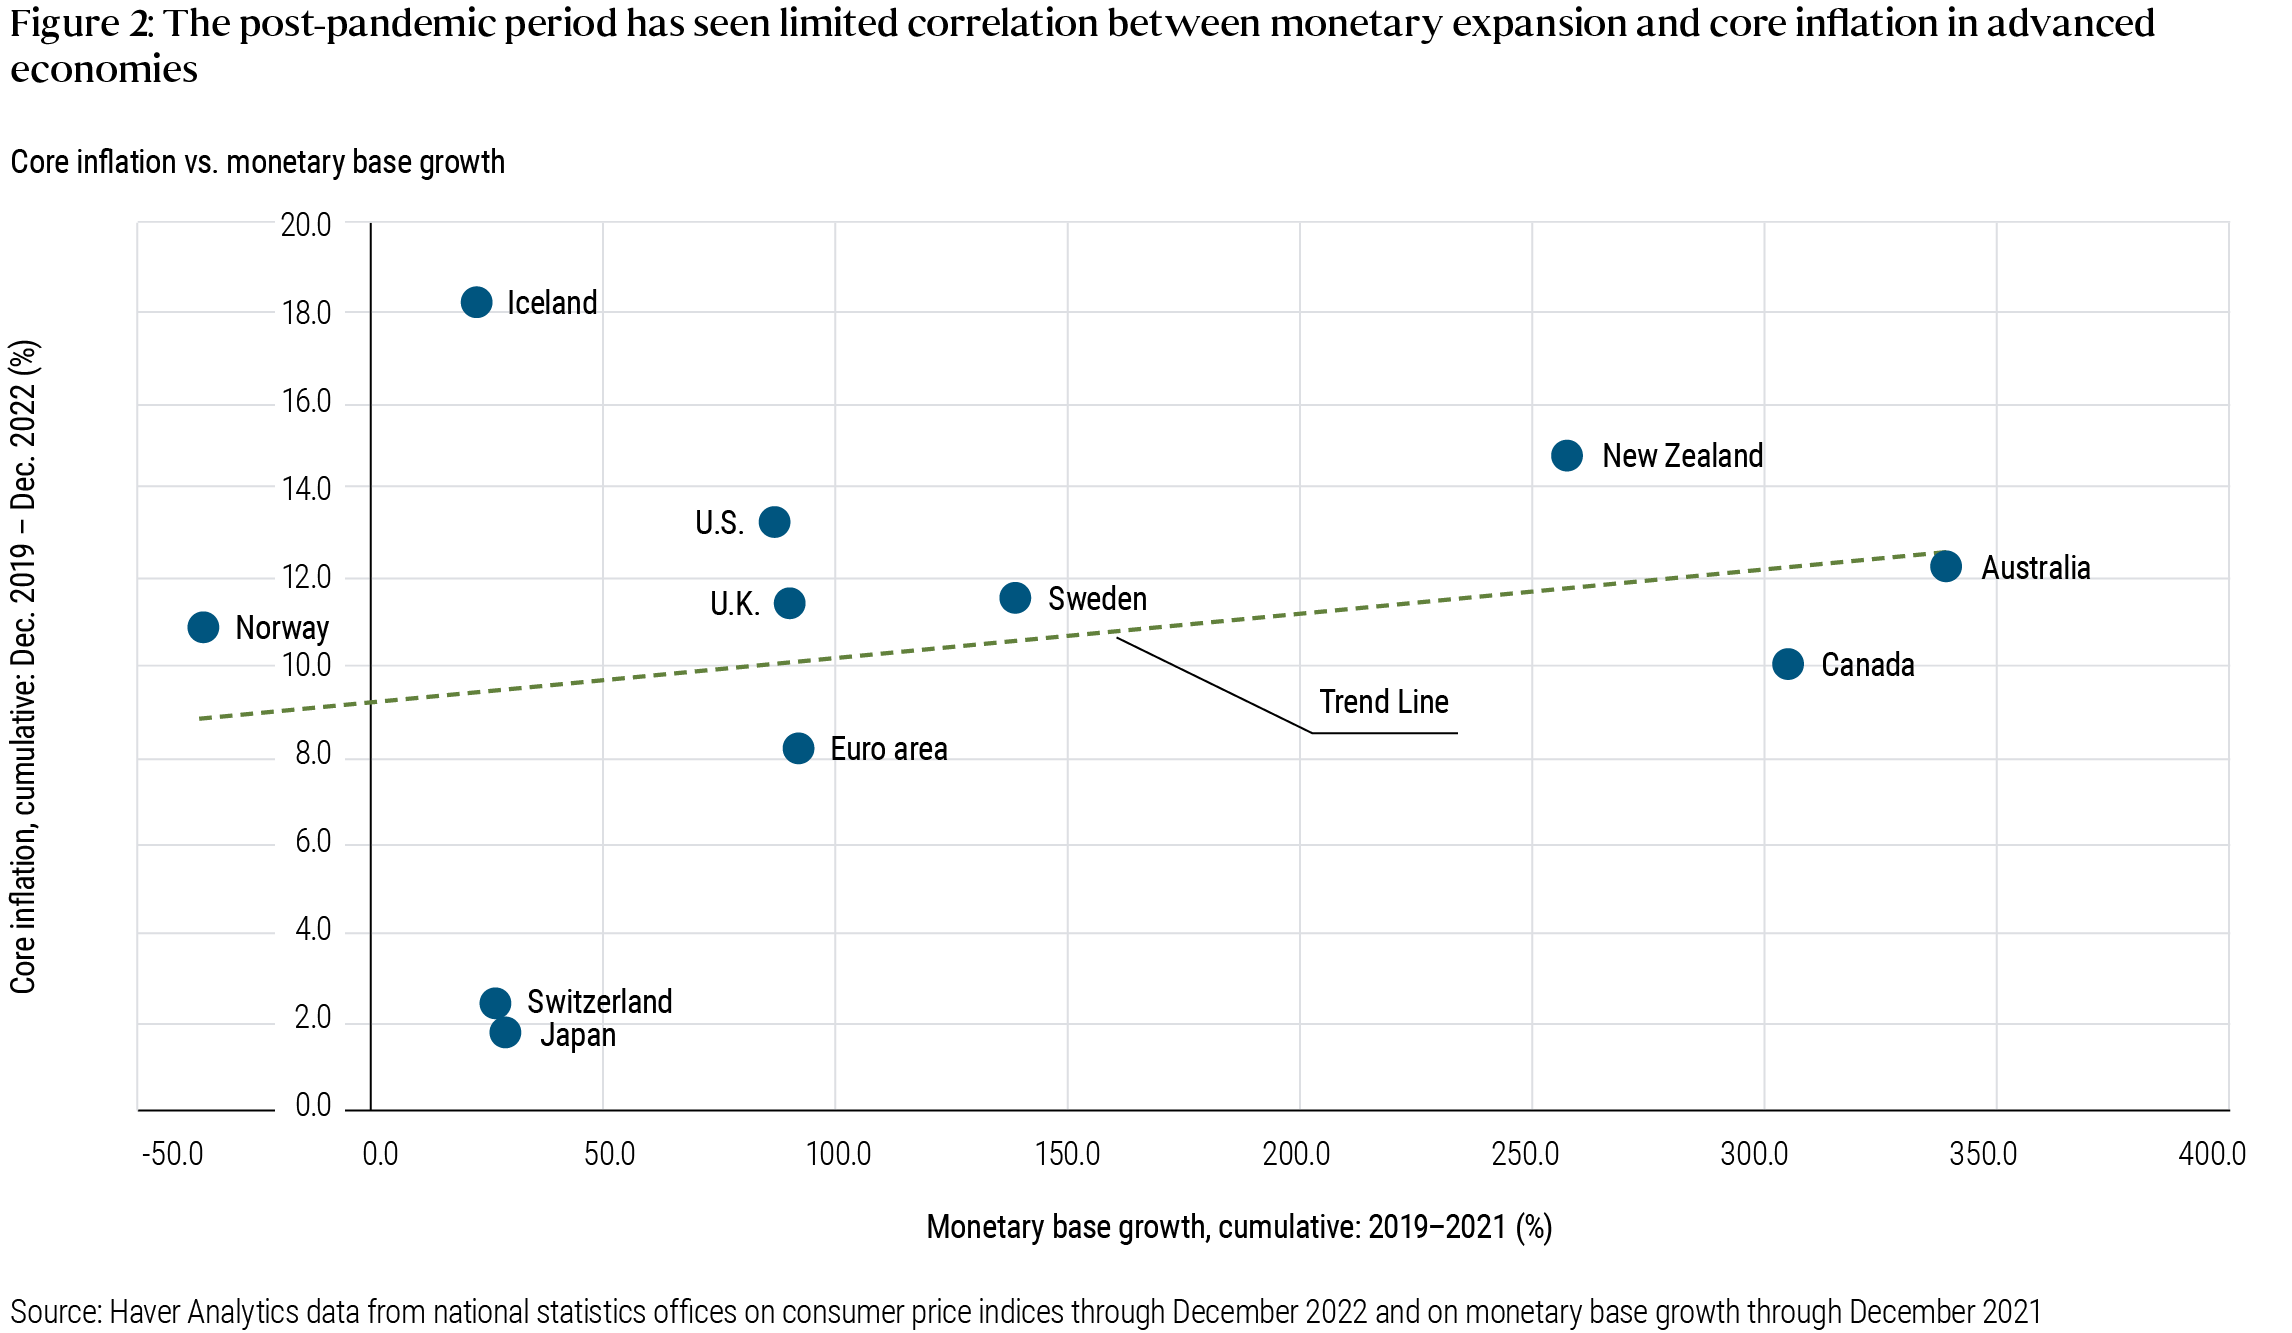
Beck-Friis and Clarida also look at money growth, above. There was a big expansion in M2 before the US inflation. Monetarists took a victory lap. M2 has since fallen a lot. There is not much correlation between monetary expansion and inflation across countries however. The slope of the regression also clearly depends on one or two points.
Money or debt, which is it? When governments print money to finance deficits (or interest-bearing reserves), fiscal theory and monetary theory agree, there is inflation. Printing money (helicopters) is perhaps particularly powerful, as debt carries a reputation and tradition of repayment, which money may not carry. A core issue separating monetary and fiscal theory is whether a big monetary expansion without deficits or other fiscal news would have any effects. Would a $5 trillion QE (buy bonds, issue money) with no deficit have had the same inflationary impact? Monetarists, yes; fiscalists, no.
Beck-Friis and Clarida opine that fiscal stimulus is over and central banks now have all the levers they need to control inflation. I'm not so sure. The US is still running a trillion or so deficit despite a 3.6% unemployment rate, and here come entitlements. And, as blog readers will know, I am less confident of the Fed's lever. We shall see.
Update:
Mark Dijkstra makes the following graph (see comments for link), based on IMF data for all countries. Hmm, doesn't look so good.

However, when you look at lots of small countries, weird things happen. The far right data point is Estonia, with 100% increase in debt and 14% cumulative inflation. Estonia started with 8.2% debt/GDP, however, so its rise to 18.4% is a 100% rise in debt to GDP ratio. So, Estonia spent 10% of GDP on covid and now military, compared to 30% of GDP for the US. Again, fiscal theory is not debt or deficit = inflation, but debt vs. ability and will to repay. One can argue that this increase in debt is more repayable. Argentina has -8% growth in debt/GDP and 100% inflation. Inflation is inflating away debt/GDP faster than the government can print the debt. The high inflation countries in this graph are Uzbekistan, Ghana, Guinea, Sierra Leone, Turkmenistan, Nigeria, Zambia, and Haiti. They are all plausibly fiscal inflation, from preexisting fiscal problems, not stable countries that suddenly borrowed/printed 30% of GDP with no plans to pay it back, the rather special case of the US, EU, UK. OK, I'm making excuses and I'm glad I started with the cautionary paragraph. Fiscal theory is not so easy as debt = inflation! But we do have to confront the numbers, and I hope this spurs some more serious analysis.
This comment has been removed by the author.
ReplyDeleteMonetary base growth probably isn't the best measure, but I'm not sure if a better measure would tell a better story...
ReplyDeleteFor the fiscal theory, shouldn't we have a third graph, showing the inflation versus the sum of the monetary base and government debt?
ReplyDeleteHow about if we assume the fiscal theory is correct, but that the only part of government debt that counts for inflation is debt not expected to be paid back. That gives us a free parameter-- the amount not expected to be paid back. If we let the data tell us the value for that parameter which best fits the data, how nice a graph do we get? It would be interesting to look at the estimated value of the parameter and see if it tells us anything, too.
In the US and most countries, most of the expansion in monetary base (reserves) comes from buying treasury debt, and fed holdings are counted as treasury debt "held by the public." So adding base and debt would be double counting. The Fed can create base by lending it to banks, but the loan counts as an asset so it's offsetting in fiscal terms. Yes, the expected to be paid back is a troublesome fact, and though not quite a free parameter it is hard to measure independently. Just as the expected dividends that drive a stock price are hard to measure independently. You go in to battle with the theory you have, not the theory you wish you had.
Deletesorry, but insufficient data. Growth of $1 to $2 Dollar is a 100%...Growth of $5 Trillion to $10 Trillion is 100%, but wholly a different beast!
ReplyDeleteby my calculation the Federal Debt per America Child is $555,000...who thinks they have any hope of paying that off.
balance sheets world’s central banks in 2000 stood at $3 trillion, 8% of the world’s $35 trillion of GDP.
By 2021 global GDP increased 2.7X to $95 trillion debt increased 15X and is NOW 47% of global GDP? The debt hot potato is GETTING HOTTER
In the top chart, I am wondering if you would get a better result with using growth in government debt per capita.
ReplyDeleteI note that Australia and Canada are well below the line, and that they have strong population growth from immigration.
I wonder if using divisia M4 rather than monetary base would show a different correlation. See https://centerforfinancialstability.org/amfm.php for US.
ReplyDeleteI wonder if using divisia M4 rather than monetary base would show a different correlation. See https://centerforfinancialstability.org/amfm.php for US.
ReplyDeleteFree parameters are not necessarily a bad thing, even if Ockham might not like them. Here, it would neat to measure the value. That can be part of the testing of the theory, too- does the estimated value seem reasonable-- though here, if the estimate were too wild, nobody would hold the theory in the first place.
ReplyDeleteConsider a country that has no debt. Then double the money supply. What do you expect would happen to the price level?
ReplyDeleteConsider a country that has debt, but the country maintains a balanced budget this year, so the debt does not increase. But the money supply doubles. What do you expect would happen to the price level?
Since the FTPL does not work in the simplest cases, I am not able to take it seriously.
a) Monetary base is government debt. So in the first case, doubling the money supply is doubling government debt. If there is no change in expected discounted surpluses, inflation rises. (Simplest with interest-bearing reserves, a bit more complex if money does not pay interest.) b) For money base to double with a balanced budget, the government must buy bonds. No change in overall government debt. We just did this with trillions of QE, which produced no inflation at all. About the best proof one can ask for. For money supply to increase without a change in base, (M2, say) that's an increase in inside money, both an asset and liability to the private sector. To first order, FTPL says no effect.
DeleteJohn Cochrane's answer is very good but maybe Joao Marcus is thinking of something else. We can imagine a country (not the US) where the government itself prints money to spend, instead of the central bank buying bonds. Suppose in that case the government starts with some debt, held by citizens or foreigners. Bonds plus money will increase, but will not double, so prices might not increase as much as in case (a) where there are no bonds outstanding. ("Might not" because it depends on how much of the debt is eternal and how much is expected to be repaid)
DeleteI'm not so sure about this one. Even the top graph looks a lot like a cloud to me. And if I make a quick graph for a wider selection of countries using IMF data (granted, this is with CPI inflation, not core inflation), I find the exact opposite relationship. If anyone's interested, I put the data with the graph in a Google sheet (data is from IMF WEO) right here: https://docs.google.com/spreadsheets/d/1pCLbzzQ9vDHL4mj-Uguux-i7hVxOTDfUfXZzh-u9M9A/edit?usp=sharing
ReplyDeleteJune CPI numbers just came out. AAAAaaahhhhhhh!!!!!!!!!! Zimbabweeee!!!! Weimer Republiccccccc!!!!! Venezuelaaaaa!!!!!! Aaaaahhhhh!!!!!!!
ReplyDeleteWheel barrels full of cashhhhhhhh!!!!!! Aaahhhh!!!!
Deletemethinks you are a bit too quick to dump on monetarism. M2 exploded and so too did inflation. M2 growth has come down very gradually since Feb/March and inflation has begun to cool - its still too high is declining. The match between money growth and inflation actually seems quite remarkable in light of the overall ability of economic models\theory to explain pretty much anything.
ReplyDeleteLikely other forces are at work too but explosion in money is clearly a big part of the story here - see Sargent's great paper on wars and inflation.
Hi John, congratulations, you nailed it!
ReplyDeleteIf you look at U.S. general govt debt/GDP, it increased of course substantially in 2020, and then in 2021/22 inflation helped it to come down… not down to the pre-covid level, but maybe back to the pre-covid trend. I have the chart but not being able to paste it here in the comment section. So a lot of inflation was required in 2021/22 to bring debt/gdp back down to the previous trend, and after that was accomplished inflation is decelerating in 2023. Am I telling this story right?
Interesting first chart. As you carefully highlight, we care about ability and willingness to repay. The higher growth rates last year in Aus and Canada vs Sweden may explain why we might have had relatively less inflation there than we might expect accounting for the cumulative debt increase. Compounding 1% higher gdp growth over a few decades and you could explain why investors might worry less about repayment of the debt burden.
ReplyDeleteAn interesting technical point is whether in evaluating whether the regression line fits well we should think of a weighted regression, with the line being close to big-economy data point is more important. I don't know whether weighted or unweighted is better. We're just eyeballing here, of course, and ignoring such things as serial correlation across countries, but I still wonder.
ReplyDeleteNeither of these charts agree with Borio et al. analysis of the BIS. They show a nice upward sloping relation with R2 of 33%. See their Graph 3. Borio et. al. rightly use a lag so that money growth is 2019-20 and inflation is 2020-2022. A contemporaneous relation ignores the basic fact that it takes "a while" (technical term) for money to work its way through the economy and into prices. Borio et. al. also use CPI which is surely the correct indicator. Core is designed to remove those "transitory" price swings but when measuring the current bout of inflation I want those "transitory" swings in food and energy to be counted as the burst in money growth was transitory too. As for removing the observations with high inflation, removing the points that make the case is not really analysis or science for that matter. Should we disregard money growth in causing, say, the German hyperinflation because it was over 50%? All in all, I think the monetarists have more to crow about than this post recognizes.
ReplyDelete