Charles Calomiris has a splendid WSJ review of a great book, "The Myth of American Inequality" by by Phil Gramm, Robert Ekelund and John Early.
It is a "'a truth universally acknowledged,' according to the Economist magazine in 2020" that
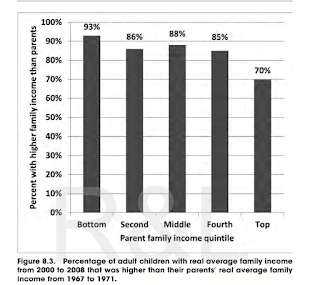
little progress has been made in raising average American living standards since the 1960s; that poverty has not been substantially reduced over the period; that the median household’s standard of living has not increased in recent years and inequality is currently high and rising
Most of all the last one.
All of this is false. Most of all the last one.
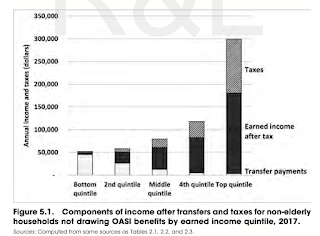
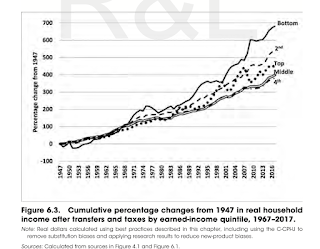
1) Income. The central jaw-dropping, astonishing fact: The statistics you read about income and income inequality ignore taxes and transfers. By doing so, of course, they create a problem that is immune to its purported solution!
Especially on the low end, transfers including in-kind transfers (housing, medical payments, etc.) are a huge part of consumption and properly measured income.
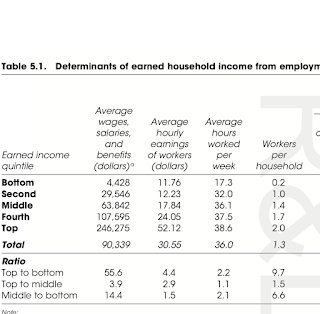
Pay especially attention on the left hand side of the graph. Actual income is essentially flat in the first three quintiles of earned income.Again, the first three deciles are dramatic. The decline in earned income in the top is indeed worrisome but it comes as above from a decline in work. Discuss among yourselves where that comes from.
This book is written in straightforward American English, not in economic think-tank jargon. It shows clearly how each element of the analysis (taxation, transfers, inflation adjustment) contributes to its conclusions. Graphs and tables are comprehensive and comprehensible. The style is lively and lucid...
The analysis probes deeply to demonstrate the robustness of its conclusions..
Most important, the authors don’t clutter their analysis with contentious approaches to measurement, and they limit their policy recommendations to those that flow self-evidently from the facts they document. It is encouraging that three disparate economists can together write an objective book about the measurement of living standards, poverty and inequality without engaging in partisan advocacy that undermines their findings. (“While we each have our opinions and political views,” writes Mr. Gramm in a preface, “we share a desire to get the facts straight.”)
My sense is that the book is not having the impact it should. Economists love complex empirical work, and the mainstream media does not, ahem, appreciate a book that so transparently demolishes the Standard Narrative.
It's a great read.
*****
Update: Much subsequent discussion here and on twitter revolves around just what's included and omitted in "income" by various authors. An email correspondent, frustrated with Blogger's comment feature (me too) sends the following response to Joe Smith, below:
A place to start is a 2018 Cato paper by John Early "Reassessing the Facts about Inequality, Poverty, and Redistribution". It includes a version of Figure 2.1 above, explanations of major categories, and lists sources.
I went to Early's very nice paper, and here are some excerpts:
- Census money income estimates explicitly exclude the following:4
- The Earned Income Tax Credit (EITC)
- The monetary value of benefits from the Supplemental Nutrition Assistance Program (SNAP), more commonly known as food stamps
- Free or subsidized medical care such as Medicaid and the Children’s Health Insurance Program (CHIP)
- Free, subsidized, or controlled rent or other “affordable housing” schemes
- Heating subsidies
- Free or reduced-fee social services such as daycare, tax preparation, or meal services
The EITC is given to low-income families with at least one employed person. In 2015, the annual credit was as much as $6,242 per household and was given to households with incomes as high as $53,267. The EITC is a “refundable” tax credit, meaning that if an individual owes no income taxes, money equal to the entire credit is sent to the filer. The EITC has all the characteristics of money income, but it is not counted as such by the Census Bureau.
The government has defined the EITC and other refundable credits as “negative taxes.” Government reports of expenditures are understated because the money paid for the EITC payments is not included. Taxes are also understated by the amount of the EITC because it is subtracted from the reported tax collections.
SNAP funds are paid as money on a debit card, but they are defined as in-kind income and not counted because they can nominally be spent only on food. Rent subsidies, free medical care through Medicaid, and any free social services are also deemed as in-kind income and are excluded from the calculations.
I found the last sentence revealing. Philosophically, the census wants to leave out "in-kind income." But of course for evaluating people's standard of living that matters a lot. It's not wrong, it's just a definition, useful for some things but not for others. Like, evaluating people's standard of living.
Interesting as well,
Compared with amounts reported to the Internal Revenue Service (IRS), the CPS underestimates retirement income by at least 60 percent in each income quintile. IRS data show 50 percent more households with private pension income, and for those households reporting pension income the IRS shows 50 percent more income than the CPS does.6 No one would report too much income to the IRS, so the higher IRS comparisons are reliably the minimum limit of underreporting.
There is a lot more in the paper, and I'm perhaps doing the book a disservice, as I recall from reading it last summer that it is very clear and transparent about what the definitions of "income" are and just why they come to such different conclusions from others. But I add this to give a flavor of the issues.
****
Update: I forgot perhaps the most important thing I learned reading this book. (I'll have to come back and make this a separate blog post at some point.) Income based social programs are based entirely on a meaningless concept of income. You get money and help for being "poor." But that only covers your market income. The marginal tax rate for earning a legal extra dollar is about 100%. But the marginal tax rate for getting one more social program dollar is zero! Spend a day figuring out how to sign up for another program, or spend a day looking for a job? The incentive is clear.


John, I have ordered the book and am looking forward to reading it. I found your summary to be excellent. Thank you.
ReplyDeleteI would like to know where a lay person can find details on transfer payments. The BEA puts out the totals but I cannot find any place where all of its components are detailed. I believe the OMB at the White House used to publish this information if my memory is correct.
I probably agree with 90% of this blog post, but on the other hand the US has followed a de facto policy of promoting cheap labor markets for the last 50 years through open borders and trade policies.
ReplyDeleteA nation with "labor shortages" is a happy country---a nation where reducing welfare would be justified.
What is the purpose of the book, other than the presentation of statistical measures? 1) to refute a common misconception? 2) to counter a socialist screed currently circulating? 3) to propose solutions that will increase the working age population seeking gainful employment? 4) get the bottom quintile off the welfare rolls? 5) point Congress in a different policy direction?
ReplyDeleteNeither the book review nor the blog article describes the book's purpose in life.
One might be inclined to see those making up the bottom quintile as 'useless mouths'. Or, alternatively, as "takers", and those in the higher quintiles as "makers". The statistical picture given is too gross to be useful. What one would want is a connection to factors such as educational achievement and educational attainment versus urban neighborhood versus income versus crime rates and incarceration rates, etc.
Including "in-kind" services as "income" doesn't measure actual income. If monthly rent represents 90% of monthly cash income, one is poor no matter how much the individual uses medical and hospital services. If the individual is poor and handicapped such that mobility is a barrier to gainful employment in the inner city neighborhood, "in-kind" services may make life bearable, but those services do little other than to ameliorate a portion of the burden of poverty. That so many seem to resent seeing their tax payments going to the lowest income quintiles says far more than statistics presented reveal.
You make the point that if an individual in the lowest quintiles earns but a dollar more, she loses access to the "in-kind" benefits that Phil Gramm et al. refer to as "transfer income"; ergo, she avoids earning that extra dollar in order to retain those benefits. One would want to know how prevalent that behavior is, how much it motivates avoidance of gainful employment, and whether there is a policy option that would provide a 'bridging solution' to encourage greater participation in the workforce.
It was said that during the Trump administration employment of the lowest echelon of working age adults increased with the remarkable result that incomes in the lowest quintiles rose faster and further than incomes in the highest quintiles. If so, then one would want to examine the record to see whether monetary and fiscal policy ought to be changed to produce more of that effect going forward.
... and so on.
"Including "in-kind" services as "income" doesn't measure actual income. If monthly rent represents 90% of monthly cash income, one is poor "
DeleteYou do realize that housing assistance is counted as "in-kind"...
'You do realize that housing assistance is counted as "in-kind"...' -- "Unknown".
DeleteIf housing assistance is paid, it is paid to the landlord. That portion of the rent that isn't covered by housing assistance is paid as rent by the tenant. I think that you will find that being poor is defined by one's money income relative to one's money expenses. Viewed in another way, what is to say that one day in the future Congress decides to do away with "in-kind" transfers and vouchers. Under that scenario which is not altogether unlikely, Gramm et al.'s analysis evaporates and the income distribution reverts (as if it ever changed) to a higher GINI number than Gramm et al.'s analysis indicates.
There's nothing new under the Sun. Looking back to Roman Empire, we see a similar concentration of wealth in the hands of a few Roman families, and wide-spread impoverishment outside those few families. In order to keep the plebians contented, the state (i.e., the patrician class) organized games and feasts and such, i.e., provided "in-kind" transfers to the poor and moderately poor populations in the major urban centers.
Gramm et al. are reacting to Piketty et al.'s criticism of the capitalist system here and in europe. Government transfers to households rely on the taxation of success to ensure that the unsuccessful don't rise up and pull down the system that yields the success. In other words, the 'Makers' must share a portion of their wealth however much they may resent the presence of the "Takers" lest they lose it all.
John, Another excellent piece. Sometimes you lose me in the language of economics, but not with this one. As a physician who has treated Medicaid patients I have said for most of my thirty three career that Medicaid is little more than a "bait and switch" for the poor. Medicaid pays physicians fees that are so low they often do not cover the costs of practice. The only way to be profitable with Medicaid is to run so many patients through so fast that quality of care is pushed aside. Medicaid red tape is onerous and obtaining pre-authorization for elective surgery and appealing denials is time-consuming. Medicaid patients are told they have health insurance but, in reality, this is much little third world socialist countries that claim their citizens have universal health insurance. Medicaid patients experience long waits to be seen for non-emergent matters and their choice of physicians is limited because so few physicians accept Medicaid patients. I practice in Central Florida. Before I finally quit accepting Medicaid because of all the above, I had patients who traveled from over 3 hours away to see me because I was the only plastic surgeon who offered medically necessary breast reductions to Medicaid patients within that radius! I rejected the Affordable Health Act (Obamacare) from the outset because its primary premise to decrease the number of uninsured was to expand Medicaid, which I knew was a solution based on ignorance or deliberate misdirection by the Obama administration. I quit the AMA because of its support of the ACA. I think time has proved me correct.
ReplyDeleteInteresting summary.
ReplyDeleteBut, if the US has a weird tax system where you have 100% marginal tax rates, has anyone formally tested your conjecture that it leads people to work less? If you can't establish it there, you can't establish it anywhere so it seems like a good case study for a micro paper.
Also, this is fairly simple work. With the amount of efforts sunk into heterogeneous agent models like HANK from people like Benjamin Moll, you'd think this would be knowm in the profession. Is it only ignored by the corporate press or is it also something most of us in economics don't know?
Finally, I am not entirely sure a love of complexity is the right word for economists. The papers that end up having the biggest impacts tend to find a clever way to make a complicated idea simple rather than the other way around -- otherwise, you only speak to the 4 or 5 people who work on the same stuff as you.
I nearly got a job with The Economist in 1964. It was a fine institution until late-century, when it went off the rails.
ReplyDeleteI got the book last month. It can't be pushed and praised enough.
ReplyDeleteI have noticed in discussing with people who have read it, that the size of the transfers astounds them. I get lots of protestant reactions, even from non-protestants. But it's really the marginal tax rate that's the problem, and you have given that suitable weight.
Anyway, the book knocked me off my perch, and your post did it again!
Average hours per week 17.3 for earned income bottom quintile is no surprise. If you include Early's excerpts, I suspect those benefits for the bottom quintile amount to $35,000 per annum. A single person earning $50,000 per year in a tax bracket of 30% (24% marginal + 6% FICA and state tax) would net about $35,000. About $25 an hour for skilled labor. Those recipients probably don't have the skills to earn 25 bucks an hour, hence those transfers are a disincentive to acquire them. Rational behavior on their part and central planners feeding the false narrative with those subsidies.
ReplyDeleteIt's actually much worse than that. A single person making $50k per year isn't in a 24% marginal bracket. See
Deletehttps://www.nerdwallet.com/article/taxes/federal-income-tax-brackets
and also don't forget about the standard deduction..
The general post is very compelling. I'm wondering about medicaid and other similar medicinal transfers though; should these be considered income? Is health insurance for white-collar workers considered income in these studies?
ReplyDeleteI'm hoping it's not the case that most of the transfers are medical services which don't count for the middle quintiles as income. If it's things like food stamps, housing vouchers, etc making up most of the transfers then the points are spot on.
Employer-sponsored health insurance ought to be counted as earnings in this framework, yes. If they aren't I would agree that the presentation is somewhat misleading.
DeleteThank you authors Gramm, Ekelund, and Early as well as Professor Cochrane for posting this on your blog. I can't recommend this book often enough. I've been pitching it to everyone and suggested that the authors be invited to speak in an online economics forum that's run out of Princeton. I got crickets from Princeton (why?) but hopefully other platforms will raise awareness of these authors' efforts to shine light/truth and restructure these social programs from our rapidly metastasizing government. Alternatively, we can simply cancel these researchers' voices and keep this Dem gravy train rolling on the tracks FDR built. ;)
ReplyDeleteIf minimum wages increase, then the financial burden of state assistance distributions should decrease I would assume, along with an increase in tax revenue. But, who is the beneficiary of the transfers: the workers with low wages or the businesses employing them (as a subsidy to keep wages lower)? Perhaps these policies buy votes of those in the lower wage areas too. I think there is more to unpick in this interesting story.
ReplyDeleteThank you for your thoughtful favorable review. Have there been any thoughtful negative reviews of the book?
ReplyDeleteWhile negative transfers, i.e. taxes, are pretty clear to value at cost, it seems straightforward and yet not quite right to value the positive transfers at cost. This largely aren't cash transfers (it seems from this---correct me if wrong), and things like Medicaid have huge layers of bureaucracy and frictions that make the cost more than the value to the recipients potentially (though could possibly go the other way). This seems true for many categories: subsidized housing is often run very poorly and are often horrible places to live.
ReplyDeleteA reasonable interpretation of this therefore could be that our government programs do a much worse job at alleviating poverty/income inequality than cash transfers. If true, the last point about the marginal tax rates also wouldn't hold. If I value the transfers at 10 cents on the dollar, a 90% tax on earned income would put this at parity.